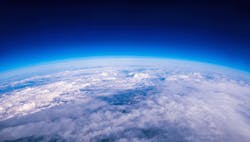
Detecting natural gas leaks from space
Q: I've been reading about the Tropomi (for TROPOspheric Monitoring Instrument) that's mounted on a satellite and is capable of measuring the size and approximate location of natural gas leaks. Could you explain how this works? How does the Tropomi distinguish natural gas from the many other component gases in the atmosphere? How is the elevation at which the methane concentration is measured selected? What's the measurement's resolution, accuracy and sensitivity, and are they better than ground-level measurement? Any information or guidance would be appreciated.
Z. Friedmann
A1: Before discussing natural gas (NG) measurement, I should note that NG isn't a "transitional-green” or "green bridge" fuel, as some in the industry might suggest. It's true that when burned, NG emits only 53 kg of carbon dioxide per million BTU, while oil emits 73 kg and coal 91 kg, but this isn't the only greenhouse gas emitted when using NG.
Methane, the primary component of NG, also increases global warming by leaking. That is, for every cubic foot of NG drawn from underground reservoirs, about 1.4% escapes into the atmosphere. The climate impact of this immense quantity of NG is substantial because methane is more than 25 times as potent as carbon dioxide in trapping heat in the atmosphere. The sum of the burning and the leaking effects of NG can reach that of coal. It's not a "transitional green" fuel.
Today, the use of NG is rising. Just in the U.S., 500,000 natural gas wells operate and 2 million miles of pipes and millions of valves, fittings, tanks, compressors and other components are all potential sources of leakage. Sixty percent of the total methane emissions come from anthropogenic (manmade) sources, and methane is second only to carbon dioxide in its global warming effect (20%). Over the past century, methane concentrations in the atmosphere have more than doubled (Figure 1).
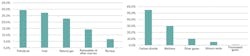
Figure 1: The bar chart (left) shows the International Energy Agency's projection of global energy resources in 2035. Natural gas is projected to account for 22.7% ofuse. Meanwhile, (right) methane already accounts for a full 30% of greenhouse gas effects.
Methane is emitted from landfills, oil and natural gas wells, transportation and use, agricultural activities, livestock enteric fermentation, coal mining, stationary and mobile combustion, wastewater treatment, and the decay of organic waste in municipal landfills. In 2020, some 400 million tons of human-linked methane was emitted globally. Most of the methane is emitted by Chinese coal production and the Russian natural gas pipelines and distribution. If fossil fuel use was eliminated and animal agriculture was phased from our diet, the reduction in methane emission by itself could stop the rise in greenhouse effects in 30 years.
Carbon dioxide remains in the atmosphere for a couple of hundred years, which means, even if it's emissions are stopped or dramatically reduced, global warming wouldn't stop for a long time. On the other hand, it takes only about a decade or two for methane to break down, so reducing methane emissions could reduce warming much more rapidly and significantly than reducing carbon dioxide emissions could.
Methane is odorless, colorless and flammable in concentrations between about 4% to 17%. Odorants are frequently added to help draw attention to leaks. Methane absorbs radiation in the short wave infrared (SWIR) and near infrared (NIR) ranges at around 2.3 to 3.0 µm in frequency. Its sensors are typically either sampling-type spectrometers or remote-monitoring types. The remote detectors are distinguished by the distance and areas they can monitor. Ground-level detectors can be handheld portable or stationary units that monitor individual leaks, or drone-mounted ones can view leaks up to a distance of about 100 meters and are used in applications such as inspecting NG pipelines or wells. Satellite based detectors can view most of the surface of the planet, and detect average methane concentrations in the air column below.
Obviously, the costs of these devices differ drastically, from a few hundred dollars for a handheld monitor to $100,000 for a drone monitor. Both can be used for leak detection. Laser-based, drone-mounted ones can detect concentrations as low as 5 ppm over a 100 m distance. In these designs, the beam is directed at targets such as gas flowmeters or natural gas pipes, analyzes diffused radiation reflected from the target in the frequency range of methane, and converts that into a reading of methane column density (ppm-m).
Satellite-based monitoring of atmospheric gas concentrations has been in use for decades; its importance was first demonstrated when chlorofluorocarbon aerosols started to destroy the ozone layer in the atmosphere. Monitoring helped make sure that new regulations were met, and the problem was slowly solved. Today, the atmospheric concentrations of aerosols, carbon monoxide, clouds, formaldehyde, methane, nitrogen oxide, sulfur dioxide, ozone and surface ultraviolet (UV) radiation are all monitored in the Earth's atmosphere.
The monitoring of methane in the atmosphere advanced when the most reliable monitoring instrument package (Tropomi) was launched in 2017 as part of the first Copernicus Programme mission dedicated to monitoring our atmosphere. It's a combination of spectrometers that measure the reflection of solar radiation from the Earth's surface, and thereby simultaneously detects the average concentration of several gases in a five-degree column of the atmosphere. This reflection is measured by four spectrometers operating in the following ranges: UV-VIS (ultraviolet and visible), which is in the 270–500 nm range; NIR (near infrared), which is in the 675–775 nm range; and SWIR (short-wave infrared), which is in the 2,305–2,385 nm range. The radiation reflection range analyzed for the measurement of methane concentration is in the absorption information from the Oxygen-A Band (760 nm) and the SWIR spectral range. Tropomi has an area resolution of about 7 km x 3.5 km area, so it has the potential to detect air pollution over individual cities or large natural gas facilities.
As the satellite moves around the world, it measures the sunlight backscattered by Earth's surface and partially absorbed by the atmosphere. It passes over an area approximately 2,600 km long and 7 km wide. It delivers up to about 20 million spectra per day, including daily measurements validated against well-maintained and calibrated, ground-based spectroradiometers, plus broadband and multichannel radiometer measurements from 25 sites. Remarkably complex algorithms are used to interpret these measurements due to the thousands of variable effects that need to be corrected for, including variations in weather, intensity changes in the solar radiation, surface albedo (reflectivity), etc.
Our process control profession should be very proud of the accomplishments of our colleagues at the Finnish Meteorological Institute for developing, operating and archiving this extremely valuable information. The International Energy Agency just reported that, based on recent satellite data, methane emissions are 70% higher than previously believed, and are accelerating faster than the use of green energy. In the Ukraine, we've also seen the indirect damage the dependence on natural gas can cause by equipping a 21st century Hitler—the mad owner of little more than a military gas station—to hold Europe hostage and potentially plunge the world into depression.
Béla Lipták
[email protected]
A2: For more details, I suggest you visit the Tropomi website (www.tropomi.eu/data-products/methane) that discusses methods, validation and ongoing results. Information up to January 2022 is presented. The measurements are of average concentration in a five-degree column of the atmosphere, using reflection from the earth surface of solar IR frequency.
Ian H. Gibson
Process, Control and Safety Engineering
Consultant
[email protected]
+61 3 9379 8538, +61 4 3136 5993

