Advancing an energy data evolution


Throughout the energy industry, companies face technical challenges involved with improving operating efficiency. These efforts are further complicated by issues associated with fluctuating market conditions and regulatory compliance, which strongly impact production decisions. Devon Energy, a large independent oil and natural gas producer, addresses these issues head on by embracing technological innovation and progressively implementing data-centric systems to enhance overall company performance.
For more than a decade, Devon invested in data technologies by following a strategy focused on accessing high-quality data, applying advanced analytics, making the results visible throughout the organization, and scaling-up successes. A key to its success has been the ability to provide useful information for a wide range of user types and to foster collaboration among them.
By researching, testing, and deploying the best-fit applications for each aspect of data management, the company continues to evolve data solutions that provide value to all categories of staff and users. This capability helps the organization enhance sustainability, performance and profitability. A key example is how Devon used Iota Software to pull together a comprehensive data solution.
Nurturing progressive innovation
Devon Energy manages a diversified mix of oil-and-gas commodities sourced from multiple U.S. basins. Operating at a large scale while maintaining a low-cost structure is essential for preserving adequate profit margins. Beginning in 2011, the company committed to improving performance by investing progressively in the following technologies:
- Enterprise-wide digitalization and data management;
- Advanced analytics for improving operational efficiencies;
- Artificial intelligence (AI) to support drilling and completions;
- Robotics for process automation;
- Cloud-connectivity;
- Computer vision;
- Software as a service (SaaS) platforms; and
- Cloud-based data historians
While there are certainly benefits to working in a single ecosystem for digitalization initiatives, the team found greater flexibility by choosing best-of-breed products for each application and technical need. Each step in this evolution resulted in performance benefits, prompting the next move.
Success was realized by performing small-scale tests of individual technologies to identify which approaches worked best, and then applying the technologies to targeted use cases to achieve quantifiable wins. When a technology proved to be easily applied, was useful for solving specific operating issues, and could be readily deployed and used by those who needed it, it was adopted and then scaled-up to additional locations.
Extracting wellbore information
A typical example of putting data to work was creating a solution to proactively identify well performance issues. One common challenge for producers is the buildup of paraffin in wellbores, which leads to reduced flow rates and decreased overall productivity. Manually monitoring and detecting this incremental buildup can consume significant labor, and introduces time delays for recognizing and resolving issues.
Devon’s solution was to combine modern technologies from Aveva and the Aveva Partner Network to create a flexible and capable wellbore monitoring approach. The progression was:
- Identify Aveva PI System servers already on-premise at well properties that collect and store data from real-time-sensors, derived values, and other production information;
- Configure Aveva PI System and Data Hub—a cloud-native and scalable SaaS industrial data management service—to aggregate, contextualize, and securely share all the PI data;
- Employ Aveva Advanced Analytics and techniques available in TwinThread, such as machine learning (ML) models, which can be trained to identify patterns and anomalies indicative of paraffin buildup; and
- Use the Iota Vue platform to provide comprehensive visualization of data and associated analytical efforts, and guide improvement efforts.
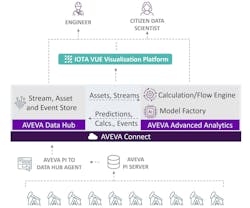
This combination resulted in a powerful wellbore-monitoring tool (Figure 1). The on-premise historians connect seamlessly with cloud-based data management, delivering high-integrity source data for well casing pressure, net gas rate and other conditions related to well performance. Predictive models were developed using this historical data to identify early signs of paraffin accumulation. Real-time data was applied to the models to detect impending problems.
A key aspect of the implementation is keeping staff in the loop, which is why the visualization delivered using Iota Vue has been an essential element. Visualization serves as both a starting point and the culmination of the data analysis process. Although every data and analytical software application offers its own interface, it’s critically important for usability and acceptance that users be furnished with one intuitive visualization environment.
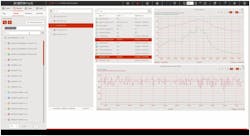
This type of software platform empowers staff to access data sets, view live well conditions and input signals, review details of the analysis process, and reveal intricate data patterns and associated insights provided by the analytics (Figure 2).
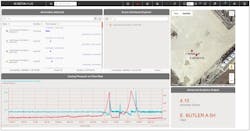
One strength of this visualization platform is its ability to seamlessly integrate with any data source, analytical software or other digital system. The visualization solution emphasizes streamlined user interactions and workflows, which fosters collaboration among users. By visually depicting information—and highlighting the most essential aspects—users are empowered to pursue informed, data-driven decision-making, so they can perform timely interventions. In many cases, optimal user clarity is achieved by combining disparate data sources, such as alarm/event logs, asset details, maps, trends and analytics output (Figure 3).
While the paraffin buildup detection example may seem a bit intricate, it’s been assembled from several smaller and proven elements, illustrating how some data projects can begin with very small value-adds.
In one case, the process team recognized there was no physical gas rate meter at a certain location. However, they knew there was enough other process information available in the area to create a “virtual” gas rate meter based on other data sources. Once this targeted application was proven, it was deployed widely in other areas, and then integrated into even more advanced scenarios, such as using the virtual meter for logic functions. To provide optimal clarity, the visualization informs users where the data is coming from, what it indicates, and how else it’s used.
Empowering citizen data scientists
A wide range of user types are interested in accessing and interacting with process data and analytics. Some examples at Devon are production/reservoir engineers, field technicians and dispatchers, control room operators and business/management personnel.
For original visualization efforts, Devon tried various native applications, along with more customized or hard-coded methods. This often required the extra complication of looping analytical results back to the historical database to provide access for visualization.
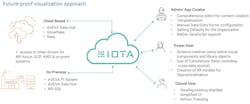
By adopting a third-party visualization solution built from the ground up to be data-agnostic, it doesn’t matter where the data is sourced. Users find this transparency, combined with better graphical objects, make the end results feel like one holistic system, regardless of how many elements operate behind the scenes.
This openness also frees the team to explore any areas of interest. In addition to time-series data (TSD), the team can take advantage of event-driven architectures, and it’s possible to test alternative cloud-based options for any of these data sources. Users can easily incorporate other analytical software, such as Seeq Workbench, Seeq Organizer, Aveva Advanced Analytics, Databricks, Snowflake, or any other platform the company uses. Iota can access and display data from multiple sources without the need to get everything in one place.
Evolving industrial data usefulness
Like many other enterprises, Devon Energy constantly seeks better ways to improve efficiency and minimize downtime. Progressive technology adoption over the years led it to find a proven approach to success.
By using Aveva data management, Aveva Advanced Analytics, and Iota Vue, Devon can rapidly deploy solutions that are easy to use and deliver immediate value. The wellbore monitoring example, which provides early detection of paraffin buildup and enables scheduled maintenance, has helped optimize production. This is just one case where a data-driven analytical application with clear visualization promotes advantageous well management, and the company can continue creating these types of solutions.
Don Morrison is the real-time systems architect for Devon Energy.
