Data analytics isn't as difficult as it used to be

In this episode of the Control Amplified podcast, Jim Montague speaks with Seeq Corp. VP and CMO Michael Risse about modern data analytics. Listen now.
All the richest, juiciest, most actionable data isn't worth spit if it can't be accessed. And all the most sophisticated analytical software, algorithms and techniques are just as worthless if they can't crunch that data to enable better decisions and optimize operations, production and profit. There's no point in either if they can't work together.
In the badder old days, obstacles between raw, detailed plant-floor data and thorough, timely analysis were mountainous. Data points, signals and parameters were manually gathered and entered on paper or old computerized spreadsheets, which were hard to organize and easy to lose. Plus, not only was the collection process arduous, but data analysis was also time and labor intensive, even with early software due to its required programming, which meant analytics typically were infrequent and unhelpful.
Well, times have changed, and many of today's data analytics tools and software are simpler and easier to use on a regular basis, and generate more useful information and decisions. Curiously, the main hurdle appears to be convincing potential users that data analytics isn't as difficult as it used to be.
"Data analytics in process applications began with clipboards and calculations by hand, and later moved to Lotus 1-2-3, Excel and other spreadsheets, which could do trends, but couldn't do statistical analysis, which still had to be done manually," says Brian Bolton, historians consultant at system integrator Maverick Technologies, a Rockwell Automation company. "Some statistical tools came later, such as Statistica, Quality America's SPC-PC IV, and MatLab, but now it seems like everyone has a data analytics tool, such as Microsoft's Power BI, Apache Hadoop, Apache Spark or Trifacta. Each provides descriptive, predictive diagnostics data, but in the past, they were limited to handling finance and manufacturing information.
"Now, with the Industrial Internet of Things (IIoT) and capturing manufacturing execution system (MES) data, users can run analytics on multiple types of information, including finance, MES, process control and others, and combine these streams to easily calculate energy used per pound of product, costs of quality levels, raw materials by time or other statistics that used to be too difficult because they required data from multiple, separate departments."
Before it can be analyzed, data must first be gathered and stored in a consistent format that enables future evaluation. Sam Russem, director of smart manufacturing at Grantek Systems Integration, a CSIA-certified system integrator with 17 offices across the globe, reports his company is working on a manufacturing execution system (MES) project for an international manufacturer developing commodity and specialized intermediate materials used in medical devices, automotive and aerospace products.
"We're helping them figure out the data storage that will be at the appropriate resolution for their requirements," Russem says. "A significant amount of critical data is still recorded on paper and it's backed up in storage cabinets. One of the challenges is that it's hard to check those backups and analyze them. You also need to consider how long you need to retain different types of information at different levels of your organization. Some information is only useful in real-time, while others may need to be stored at an enterprise-level for 20 years or more."
Previously, each of the manufacturer's sites used their own data storage strategy and 5-, 10- or 25-year retention period based on the type of material they were making. Some of these storage strategies could be performed using their SCADA system, but again, tracking and trending capabilities were limited. In addition, Russem reports the company is presently adopting a more standardized MES which also focuses on production management, overall equipment effectiveness (OEE), operational key performance indicators (KPI), and statistical process control (SPC). This solution employs Ignition SCADA software from Inductive Automation and Sepasoft's MES software modules for OEE, downtime monitoring, recipe management, SPC quality, and tracking and tracing.
"MES platforms specialize in consolidating and referencing data from multiple sources, which is required for analytics, including predictive maintenance," explains Russem. "It’s also an enabling technology for doing data analytics in the cloud. MES technologies can help connect your plant Process Historian to external systems like your ERP and cloud analytics in an organized and controlled way."
Brian Joe, wireless product manager at Emerson Automation Solutions, adds: "Data analytics software has been evolving lately due to promise of digital transformation and IIoT in process industries. Analytics and IIoT are providing users with the ability to apply predictive diagnostics to equipment and assets. For example, with more data available than ever before, especially from WirelessHART sensors, personnel can collect continuous data on assets that was previously deemed cost prohibitive. Wireless pressure, temperature, vibration, acoustic, corrosion, flow transmitters, etc., now allow more and more data to be collected on important assets such as pumps, heat exchangers, steam traps, PRVs, etc. This data can then be analyzed using analytic tools to identify abnormal situations.
"Model-based analytics allow algorithms to be developed for an increasing number of root causes and failure modes to predict problems before they affect operations. This allows maintenance, reliability, safety, energy and other departments to make more intelligent and quicker decisions about their operations. With these educated decisions come cost savings, cost avoidances, improved maintenance, increased reliability, better safety and lower energy costs."
Predictive oyster protection
One utility that knows about too little/too late data is TasWater, Tasmania's water and sewage utility, which suffered a blockage and spill in August 2017 in the Hobart suburb of Midway Point. The utility responded immediately, but not before 6,000-liters of wastewater spilled into the adjacent Pitt Water Nature Reserve and its 14-heactare oyster lease, contaminating the beds and halting production for three weeks.
“Sewage spills are an unavoidable reality of managing a sewage network,” says Matt Jordan, network asset performance manager at TasWater. “With the volume of our network, keeping it blockage free is impossible.” TasWater manages almost 5,000 kilometers of sewer mains, and suffers about 2,000 spills and main breaks per year. About 70% of these are due to tree roots, but those can be predicted and prevented by root cutting. “The one that really gets us is foreign objects,” he explained. “These are items like diapers, hand towels or Coke bottles. You name it, and it somehow ends up in the sewage system. You may have the world's best maintenance strategy, but the day after you clean it, a foreign object can end up in there. They're the ones that are unpredictable.”
To spot and respond to blockages and spills sooner, TasWater began working with system integrator Nukon in Hobart, PI system from OSIsoft and advanced analytics software from Seeq to evaluate sewage pump station (SPS) data and their defined operating characteristics. By analyzing just one data point—whether or not a pump was running—TasWater discovered that time-to-fill or time between pump runs was the key determinant of an SPS operating profile. When these periods exceed what's normal, it suggests the wet well collecting incoming water from the sewer system is taking too long to fill and that a blockage may be happening upstream. To use this evidence, Nukon and TasWater created models of normal pump behavior and used Asset Framework in PI Server and its templates to set up event frames and notifications for out-of-bounds conditions.
“These notifications happen in real time so there's no waiting around,” says Andrew May, senior consultant at Nukon. The team reports if TasWater had this data model in 2017, it could have detected the Midway Point blockage 13 hours before a customer called to report it, but even more gains were possible later.
"We’ve seen a step-function improvement in data analytics and artificial intelligence in the past several years. A decade ago, the only place you could see image analysis software was in university or national labs. Now, Google can identify individuals in your home photos with very little meta data. Bayesian mathematics have fundamentally changed what can be accomplished with digital technology," says Chris Nelson, software development VP at OSIsoft. "Then there’s the market opportunity. Though industrial markets are somewhat conservative, they've begun to realize they can build their bottom line by shaving their energy, cutting expenditures, and increasing productivity by a few percentage points. Software is far less expensive than new capital. If you read reports from McKinsey or IDC, two thirds of the opportunities for saving money in digital transformation are rooted in industrial applications. Software developers have responded to this opportunity by bringing what they’ve accomplished in search and other fields to the industry."
Emerson's Joe adds: "Analytics today are available via many deployment avenues. Data analytics programs can be installed on-premise on physical servers, standalone workstations or virtual servers. These same analytics can be installed in cloud environments. The host type and location are up to the user and their digital transformation strategy. Often, asset-based analytics are run on the edge or on-premise environments to diagnose and compute closer to the asset itself. This allows decisions affecting reliability, maintenance, energy usage, etc. to be made quickly and intelligently at the source. Cloud environments may be used for deeper analysis into fleet-wide computations and efficiency. The use case should dictate where the analytics interact and live.
"Today’s technologies enable data analytics to happen in real time, at a fraction of the cost, with scalable deployments. Historically, methods for performing such analyses were created from scratch, using expensive programming and unique user interfaces. Sometimes, simple files were run periodically via programs like Microsoft Excel. These resulted in specialized feedback, but weren't built for scalability or continuous processing. These insights can now be realized anywhere and anytime on a more continuous basis. Edge applications continuously assess the health of equipment, assets and processes—instead of periodic manual analysis. This allows quicker feedback for better decision making. Apps like these are often dedicated to a specific type of plant asset or subsystem, so they can perform whatever analytics may be necessary without requiring a high level of expertise from the user. They can work in combination with active or passive subsystems since they can connect with the instrumentation directly and do not have to work through a PLC or DCS, although this is also an option."
Shorter time-series
Because basic, time-series data (TSD) streams have been flowing out of many process applications for decades, users have had more time to make them easier to access and analyze.
"The best way to describe data analytics is it's a toolset of software programs for manipulating data, which gives users insight and control without having to try and optimize their processes ahead of time," says Nicholas Malott, technology analyst at system integrator Interstates Control Systems Inc. in Sioux Center, Iowa. "Previously, users talked about descriptive analytics, phases of processes, errors and out-of-spec as the events that would lead them to take action. However, a lot has changed due to added computing resources available. While it's hard to do diagnostics and predictive analytics, individual users can do it if they know the process, but no one wants a person to sit there all the time. They want a computer to monitor the process and alert the user when needed."
Malott reports there's a lot of talk about machine learning (ML) and artificial intelligence (AI), but they're still essentially predictive analytics based on what's happened in the past and accelerated with computing power that lets engineers and data scientists find new correlations and better performance. "For instance, ambient humidity can be coordinated with temperature data, and users can see the impact on their process through improved optimization and better products," says Malott. "In the past, it could take months and years to study how temperature and humidity might interact in a specific application, but now, models can be trained to find correlations almost immediately, and there are significant ways to regulate temperature to aid product quality."
Interstates works with clients that have steam traps, essentially "trap doors for cooling," all over their facilities. However, their gaskets periodically wear out, letting some steam escape, losing heat and pressure, and reducing the effectiveness of the overall system. "As a result, we monitor stream traps for heat loss using sound," says Malott. Previously, they'd be checked manually and/or scheduled for replacement every six months but monitoring with analytics means establishing sound profiles for normal operations, looking for changes outside of expectations, and finding anomalies and adding them to the shift-planning group in a timely manner. This lets users know if they need to replace a gasket in three months or 18 months, which allows better maintenance planning and greater efficiency."
In addition, while sensors were traditionally wired to panels and controls, Malott adds users can now put magnetic, Internet protocol (IP)-based sensors from Advantech, Banner, Panduit and others next to steam traps; collect temperature, sound or other information; and communicate it via data-aggregating gateways, WiFi, MQTT or other methods to IT-level systems like SQL, MES, and relational or cloud databases. "We usually used fanless, headless, IP-rated PCs as gateways that can take IP-based protocols like MQTT; let sensor data communicate with them; and relay it to databases like SQL," he says. "We typically use XML as our data format, and compile flat TSD databases with just tag names, time stamps and data values. This is where the analytics comes in for better process knowledge."
Emerson's Joe acknowledges that: "Almost every process industry segment experiences problems with heat exchangers. They foul and degrade over time, causing operators to maintain them on set schedules. Data analytics can give staff more visibility and actionable information regarding required heat exchanger maintenance. Heat duty and fouling calculations are used to alert the user before these conditions significantly impact energy costs and/or throughput. This allows the plant to more effectively plan maintenance and turnarounds. Similarly, pressure relief valve monitoring has become increasingly important for refineries due to new environmental regulations. Data analytic solutions use data from acoustic sensors to accurately detect when PRVs are releasing, leaking or simmering. This eliminates valuable time spent by operators trying to manually analyze process data to determine whether a release has occurred from their PRVs. It also eliminates sending personnel into dangerous situations to assess the health of the PRV."

Figure 1: DashHub module in TrendMiner 2019.R2 analytics software works with TrendMiner's ContextHub module to show third-party operations, and let users easily jump between ContextHub and its TrendHub graphics module. In this case, TrendHub and ContextHub views can be displayed as resizable tiles to create user-designed dashboards.
Nick Petrosyan, data analytics engineer at TrendMiner, reports that DashHub for reporting and dash-boarding in its new TrendMiner version 2019.R2 software is a self-service analytics platform specializing in TSD along with contextual information. It provides visual and actionable representations of operational data, and enables users to monitor, analyze and predict performance through pattern recognition of TSD trends (Figure 1). DashHub lets users monitor process behaviors related to specific KPIs, and quickly view key sensor data, which enables rapid detection of root causes and actionable intelligence when problems arise. DashHub also works with TrendMiner's ContextHub repository for event-based data such as work orders, quality data and data labeled through TrendMiner. Also, as of 2019.R2, ContextHub can be integrated with third-party data sources, such as laboratory or maintenance management systems, through flexible field creation.
"Data analytics means different things to different people. For some, it's a simple dashboard for KPI transparency, but TrendMiner focuses on maximizing the value users get out of TSD, especially in root-cause analytics efforts," says Petrosyan. "The costs of data analytics used to be very high, but self-service analytics are reducing them due to the streamlining provided by software. Building clean and optimized analytics pipelines greatly accelerates the time-to-value of troubleshooting efforts. Key analytical correlations and pattern recognition technology enables human intelligence to produce valuable analytics in the fraction of time. This is like a Swiss Army knife for TSD. For example, we can quickly find multiple time periods for comparing on-spec and off-spec performance of an operating plant, and learn the differences in operating behavior based on sensor data. Once these differences are identified, monitors can be easily deployed in the software to prevent recurrence of poor performance."
Simpler streams hit moving targets
Two primary goals of recent data analytics programs are coordinating traditionally separate data sources as they arrive to be analyzed, and giving different users the particular details they want from overall results coming out—though both are quickly evolving .
For instance, Azure Power generates solar-sourced electricity for government, industrial and commercial users in India, but it recently needed to add support for a weather station by monitoring weather details from four types of remote field device, including:
-
Pyranometer, which is an actinometer with a 4-20mA output, for measuring solar irradiance on solar panel surfaces and solar radiation flux density from the hemisphere above;
-
Wind vane, which is another 4-20mA output instrument, showing wind direction;
-
Solar inverter that converts variable direct current of a solar panel into a utility frequency alternating current that can be used by commercial electrical grids or other off-grid electrical networks; and
-
Photovoltaic (PV) module temperature sensor that measures the temperature of PV modules and provides RTD output.
Azure wanted to monitor and log data from each remote device to meet application requirements; use SCADA connectivity to environmental monitoring to gain automated feedback; and analyze energy production versus consumption of the weather station's installed systems based on ambient conditions. It initially used two webBox devices, one in the control room and the other linking the weather station's devices, and linked them using RS-485, serial Modbus and Modbus TCP to reach its cloud-computing service. However, this required 1.5 km of RS-485 cabling and two devices to reach Azure's Ethernet network, which caused problems and required repairs.
As a result, Azure worked with system integrator Arc Auto-Tech in New Delhi, India, which built a cabinet for the solar inverter, pyranometer, wind vane, PV module and temperature sensors, and added Red Lion's CSMSTRSX modular controller, two PID modules, N-Tron Ethenet switch, and a commercial cellular router. The controller handled serial-to-Ethernet protocol conversion, data logging and web server tasks, which let it connect to Azure's Ethernet network, store data in the cloud, skip RS-485 cabling, and monitor local and remote data. Finally, CSMSTRSX-enabled data logging, display and storage on CompactFlash media and/or a remote FTP server in CSV format, which could be viewed and analyzed using commercial software like Microsoft Excel, while its web server allowed remote data access and creation of intuitive HMI screens, even though no SCADA software was required.
Similarly, Maverick reports its Enterprise Integration Group works with process applications running the usual PLCs, collecting data in OSIsoft's PI System or Rockwell Automation's FactoryTalk historians, and reporting via an OPC server to an MES and other enterprise-level software, such as data analytics that lets them pick what parameters they want to compare and investigate.
Learn about modern historians from Panacea Technologies' Will Aja and Grantek Systems Integration's Sam Russem
"For example, a manufacturer may use five costly raw materials to charge a vessel for making many products, and wants to know the costs for making them. Usually, they want to know the changes and costs as materials move from storage to reactor, so they can get their process closer to perfect," says Bolton. "However, that isn’t drilling down far enough because the vessel may make 40 different products, so users need to break down their process to find the raw material charging capability for each product. Breaking down the analysis to the charge level helps achieve the lowest 'deviation from target' possible. Using statistical analysis rules, and the data being produced, users can rely on the software built into their PLCs, HMIs and DCSs and/or their visualization applications to display onscreen where each point lands on a trend, and show if it's within specification or not. Data analytics is moving to include a lot more details about what’s happening in process applications."
Bolton adds that Maverick works with users on their high-level goals to determine which analytical scope and function will help achieve them, which is especially necessary because all these parts keep shifting. "The types of analytics people ask for is always changing," explains Bolton. "Previously, they wanted to know hours of operations and amounts of product produced, which the historians and DCSs had already. However, analytics are trending toward verifying or altering scheduled maintenance, identifying equipment that's about to fail, and employing ML methods on historian data. For example, ML can help examine vibrations in pump motors, and use data from previous operations and maintenance records to indication upcoming failures in six months, six weeks or six days.
"This is even changing what data gets stored in historians in the first place. Previously, data storage was limited, so analysis was, too. Now, memory is cheap; users can keep more data for more granular analytics, trends and models; use it to compare performance calculations to simulated calculations; and better determine when performance is likely to fall off."
Bolton adds many users no longer need to stand next to equipment with meters and laptops, and instead use sensors with built-in Wi-Fi to send information to databases. "This lets users look beyond batch and production times to also integrate energy used, ambient conditions, raw material prices and more precise asset integration," he says. "We could always do some data analysis in the past, but it took a lot of time to wade through all the data to find the right operating conditions and adjust them. Now, we can meld multiple data streams much quicker, and apply their results in real-time or closer to it. Users know more about conditions that can cause bad batches, and they can also look for conditions to help achieve golden batches."
Innovations in analytics
With so many different parties trying to skin the same data analytics cat, it's especially important for users investigate the different types of available software and their capabilities, and evaluate how well they can serve the unique needs of individual applications. Interstates' Malott reports there are three primary types of data analytics platforms:
-
Business intelligence (BI) and visualization tools, such as Spotfire, Power BI, Tableau and SAP Hana. They're self-service, low-cost and sometimes free, and visualize data before moving it to a software as a service (SaaS) program.
-
Application enablement platforms (AEP) that allow more back-and-forth control via a web interface that can write back to the system, and change and manage production. These packages include Inductive Automation's Ignition software, PTCS's ThingWorks, Microsoft's Power Apps, and Opto 22's groov software.
-
Self-service analytics tools that let users create data flows, do inline analytics, and push results without having an HMI or other intervention. Though not quite there yet, the goal of these tools is to use closed-loop-style feedback to let systems run themselves. They can also branch out to do analytics for cybersecurity by examining network traffic without hindering production.
"Software using ML or AI will show the true power of analytics, and go beyond pretty charts," adds Malott. "The system itself will learn to react, and only notify users about issues they need to respond to. Who knows? Automatic guided vehicles (AGV) with robots may eventually replace steam trap gaskets, but not yet."
For now, Interstates uses Spotfire for performance and quality monitoring, but it starts by focusing on specific use cases and the data they require, so it doesn't end up with a huge mass of hard-to-handle data. "We identify how the user is going to take advantage of the data gathered, and then look for further ways it can be used for continued benefits," adds Malott. "Our advice on data analytics would be to not get hung up on the same old approach. We often review how we're doing analytics in particular processes and make rapid changes. Plus, there are new applications every year, so we have to monitor the industry, see what new tools we can use, and learn what's best. No one app will hit every nail and fix every pain point. It will likely take two or three types of software to address all your needs."
Kévin Rueff, product manager for process solutions at Endress+Hauser reports its new Neltilion digital services environment consists of several Internet-based platforms and services to make data handling and analysis more straightforward and simpler to apply on a regular basis. These platforms include:
-
Netilion Analytics that deliver an inventory of a production facility in a few minutes to enable transparency and provide optimization suggestions calculated for the plant based on the inventory;
-
Netilion Health lets production assets report on their conditions, so users anywhere immediately know how their facility is doing, as well as reasons and remedies for those conditions;
-
Netilion Library makes the collective knowledge of a plant immediately available at any time and from anywhere to all staff to save on search time and archiving (Figure 2); and
-
Netilion Smart Systems are complete packages of measurement technology, communication solutions and mobile apps that let users immediately access measurement data at any time and from anywhere to ensure ideal production conditions and perspectives for success.
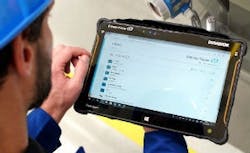
Figure 2: Endress+Hauser's Netilion digital services environment includes Netilion Library file management service that makes the collective knowledge of a plant immediately available at any time and from anywhere to all staff to save on search time and archiving. Files can be uploaded to Endress+Hauser's Field Xpert tablet PC, other tablets or notebook PCs, or smart phones. Source: Endress+Hauser
"The analyses we've been doing for several years are simplified thanks to better access to data," says Rueff. "Internet technologies also facilitate consumption of information. Today, the aim is to make information available, visible and consumable. For example, we can very easily say what's currently installed and how many installed instruments are obsolete, an important factor in optimization. We're also constantly developing knowledge and algorithms to enable more advanced analysis. For example, we can detect corrosion or abrasion in a pipe from sensor data. We are also beginning predict dates of the next required events. We're heading in the right direction toward predictive maintenance."
AI and ML on deck
Two of the most frequently mentioned technologies related to data analytics are AI and ML. However, although both have the potential to help data analytics in process applications, the jury is still out on how much AI and ML are doing it so far.
Yota Furukawa, head of the New Field Development Center at Yokogawa Electric Corp. adds that: "Many data analytics methods and tools were developed for use in the process industries to solve various problems, but there are several problems that classic tools and methods could not solve. As ML and AI technologies were developed in the IT industry, they were expected to address these issues, but our observations show they can't be simply applied to process applications. However, combining ML, AI, plant domain knowledge and first principle modeling recently, gradually became more sophisticated, and can now solve some of these difficult problems. We think this combination has triggered an evolution.”
Furukawa reports that Yokogawa provides solutions for anomaly detection in systems of assets such as motors and compressors, optimization of plant processes and root cause analysis of past failures. They're implemented using a portfolio of data analysis methods leveraging Yokogawa’s proprietary domain knowledge. Using ML/AI, anomaly sign detection of a compressor is one example described in Yokogawa Electric Report, Vol. 60, No. 1, p. 35-38, in the section titled “Compressor System State Diagnosis and Failure Sign Detection.”
"We think no ML/AI or other methods can solve customers’ problems well unless they are applied using domain knowledge," adds Furukawa. "Instead, ML/AI should be used to leverage human domain knowledge for problem solving. We think the effective integration of domain knowledge with the latest technologies is the most important concept or approach to data analysis."
Spread the digital news
Back down under Australia, TasWater reports inexpensive implementation and quick deployment of its models using PI and Seeq further benefited it because it used Asset Framework's templates feature to quickly expand the pilot project from the initial pump station to all SPS sites in Midway Point in less than one month. They quickly started tracking about 50,000 data points, and were expected to increase to more than 200,000 points.
Though the utility hadn't experienced another blockage, TasWater's data model also gave it unexpected insight into the sewage network. For example, increased pump activity during a recent storm revealed leaky segments in the sewer system, which enabled TasWater to target funding to minimize inflow and infiltration, and avoid excessive pump use. Once the pilot program ends, the utility hopes to roll out its model-based solution to all its SPSs in sensitive areas, and expanding its ability to protect the health and safety of its customers, and the local environment including the oysters.
"We’re hopeful this program can be used wherever our assets are in high risk areas, and help TasWater work more responsively with shellfish growers for better outcomes,” adds Alexander Jovcic, service optimization department manager at TasWater.

Figure 3: Fixed-Bed Catalyst End-of-Run (EOR) prediction software from Seeq helps users employ first-principles equations to quickly calculate weighted average bed temperatures (WABT) for fixed-bed reactors to monitor catalyst deactivation. However, adding new connection options, such as the upcoming AWS Timestream time-series database, can bring it to users on the Internet and quickly distribute its advantages more widely. Source: Seeq
Naturally, as web-based solutions, including architectures and deployments, and the Internet continue to take over the digitalized universe, more data analytics tasks will be performed in the cloud, although some users will prefer to continue their work on premise, or deploy solutions using a mix of the two approaches. For example, Seeq's model for Fixed-Bed Catalyst End-of-Run (EOR) prediction may be run either on premise or in the cloud, while accessing sensor data stored in either location. This model helps users employ first-principles equations to quickly calculate weighted average bed temperatures (WABT) for fixed-bed reactors to monitor catalyst deactivation, and lets operators create models to predict WABT as a function of time within capsules for steady state (Figure 3). By monitoring the WABT and estimating when it will reach the system’s maximum operating temperature, maintenance planning may be improved. Once developed, this model could be applied to data residing in any TSD, on premise, or in the cloud.
"Users have a host of options for TSD storage from traditional vendors like AspenTech (IP21), GE (Proficy), cloud-based services from Amazon Web Services (AWS) and Microsoft, and infrastructure platform providers such as OSIsoft," says Michael Risse, VP and CMO at Seeq, who reports that AWS' upcoming Timesteam is an example of new cloud-based, time-series database services for IoT and operational applications that can store process data at lower cost than traditional historian databases. "Once users get their data stored and organized, they can decide where they want to work with it and what they're looking for, whether it's monitoring, machine learning, reporting, statistics or root-cause analysis. As a result, with advanced analytics, including sharing results over the web with colleagues and partners to enable better decisions, customers are improving their operations and business outcomes."
OSIsoft's Nelson adds that, "Data analytics let users tackle problems that were impossible or impractical before. Cemex, the world’s largest cement maker, runs 70 plants worldwide. When it wanted to compare plant performance with historical data, it took around 800 employee hours to gather and clean the data. As a result, they could only run a very finite number of analytics and these analytics tended to be somewhat backward looking. Now, data prep [with help from OSIsoft' PI System] takes around 10 minutes, which paved the way to conduct more analytics at a lower cost. Similarly, Syncrude, the largest synthetic crude oil provider in Canada, was experiencing a rash of 'ventilator events' (i.e., engine explosions) that created a vent clean through its bulldozers. After tracking 6,600 data points from 131 trucks [also by using PI System], the company figured out the problem and has been saving $20 million a year in maintenance. It also discovered that employees weren’t following the safety procedures all the time, leading to an increased risk of spinal injuries. Without better data management and analytics, these could have remained chronic, unresolved problems.
"Most analytics will continue to be performed by people. If you show engineers a trend line, they can often determine the problem as well as come up with a solution. The vast majority of analytics will effectively involve someone or a group of people tapping into a data stream and coming up with an answer on their own. That said, yes, they'll also use additional software applications. What will fade in importance is where these take place. Cloud and edge will be two sides of the same coin, and analytics will take place in both. The big question will be whether it’s more cost-effective to perform problems in a cloud environment or at the edge. Many private clouds will be indistinguishable from existing in-house data centers—the only difference will be who owns them. Ethernet might fade out because wireless is increasingly robust and cheaper to deploy."