Steady state and transient state identification

Identification of both steady state (SS) and transient state (TS) in noisy process signals is important. Steady-state models are widely used in process control, online process analysis and process optimization. Additionally, detection of SS triggers the collection of data for process fault detection, data reconciliation, the end of an experimental trial (when you collect data and implement the next set of conditions), etc. The use of SS models should only be triggered when the process is at SS.
In contrast, time-dependent models are also used in control, forecasting and scheduling applications. Dynamic models have coefficients representing time-constants and delays, which should only be adjusted to fit data from transient conditions. Detection of TS triggers the collection of data for dynamic modeling, provides recognition of points of change, triggers data recording, etc.
If SS and TS detection were automated, the computer could flag the operator, or possibly autonomously trigger appropriate events, removing human bias in interpreting SS or TS conditions.
I've been exploring automation of the detection of SS and TS for chemical process applications. Processes are characterized by coupled and nonlinear responses, autocorrelation, signal noise, spurious events and flatlining measurements (for any number of reasons such as maintenance, sensor failure, data discretization). All characteristics change with operating conditions. Also, the manufacturing environment requires simplicity in algorithms.
If a process signal was noiseless, then SS or TS identification would be trivial. At steady state there is no change in data value. Alternately, if there's a change in data value, the process is in a transient state. However, since process variables are usually noisy, the identification needs to "see" through the noise, and should announce probable SS or probable TS conditions, as opposed to definitive SS or definitive TS situations. It should also have a very low frequency of false statements (such as claiming TS when at SS, or claiming SS when in a TS).
VBA code free to download
I offer a tutorial that explains five approaches to probable SS and TS identification at my website (www.r3eda.com). Use the “Steady State” menu item to download a pdf. No strings attached. It reveals techniques and provides the code to implement the methods. I also have a simulator that lets you generate data with diverse signal characteristics (noise amplitude, noise autocorrelation, discretization) and responses (step change, first-order change, ramp, oscillation) to explore the various methods. You can also import your own data.
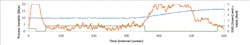
Figure 1 is typical of the simulator, representing a third-order process change and a noisy signal with mild autocorrelation and discretization. The graph shows how three key signals evolve in time. The blue signal that starts at about 10 (on the left axis) is the process signal. It begins a third-order change to a value of about 17 at a time counter of 300. The identification methods are statistical, and the red signal is the statistic value. The method is initialized at time zero, with values of zero for all the prior data, and the statistic value immediately rises to a high level as the first non-zero data are populated. At a time of about 50, the statistic falls to the nominal value of about unity (on the right axis), indicating steady state. At a time counter of about 350, when the PV change becomes clearly visible, the statistic rises to high values (about 5); and as the transient ends, the statistic begins to relax back to the steady value. Finally, the black line that makes steps at the bottom of the graph represents the probable SS (1 on the right axis) or TS (0 on the right axis) claim. Initially, the identifier value is 0.5 because there was no information. As non-zero data begins to be collected, it's confident that something changed, and at a time of about 20, reports an identifier value of 0. Then, once fully populated, the algorithm is confident that the process is at SS, and reports the value of 1. When the PV change becomes certain, it drops the identifier value to 0; then at about a time of 580, when things have settled back to SS, it reports a value of unity.
The code in the Excel VBA program is open. If you're interested in having the file that applies the five SS-TS identification methods, send me an email at either [email protected] or [email protected]. I’ll send it to you with operating instructions. (I gave away knowledge as a teacher, and still enjoy doing so.)

About the Author

R. Russell Rhinehart
Columnist
Russ Rhinehart started his career in the process industry. After 13 years and rising to engineering supervision, he transitioned to a 31-year academic career. Now “retired," he returns to coaching professionals through books, articles, short courses, and postings to his website at www.r3eda.com.
