
The work of an optimization engineer involves finding ways to increase the amount of product the plant produces using its existing equipment, combined with reducing costs wherever possible, all while maintaining critical product quality attributes. Some modest spending for equipment upgrades is normally expected to accomplish these tasks, but usually the idea is to avoid significant capital costs. So, let’s think about how this applies to making beer, and then look at an example of how a simple instrumentation improvement brought about major production improvements, while preserving all the product attributes our customers expect.
Beer is a food product, and no matter how much the process is instrumented and automated, it's still subject to the variability of agricultural feedstocks (barley, hops, etc.) and biological processes (fermentation using a living organism—yeast). The recipes and procedures do not work the same way every time, and even small changes in feedstock or process conditions can have a significant impact on the characteristics of the final product. There are ways to quantify and measure some critical attributes, but ultimately the human element plays a major role in regulating the process to ensure the consistency consumers expect.
The MillerCoors brewery in Milwaukee, Wisconsin, produces many types of beer using different recipes under a variety of brands, but the basic process is fairly similar for all. (Many resources are available to fill in the brewing process in greater detail.) For this discussion, we'll focus on fermenters, where yeast converts glucose in the wort into ethanol and carbon dioxide (CO2):
We tend to think of ethanol as the primary product, but an equal amount of CO2, by weight, is produced—it’s an important byproduct of the brewing process.
The fermenter fleet
There are 26 main fermenters standing outside at the Milwaukee facility (Figure 1). “J” House has 14, each 5,000 bbl., and “M” House has 12, each 6,000 bbl. (When dealing with beer, a barrel is 31 U.S. gallons.) These fermenters are all insulated stainless steel vertical vessels, equipped with cooling coils fed by a glycol chilling system built into the walls to remove heat generated by fermentation, and for final cooling when fermentation is finished.
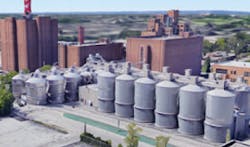
Figure 1: The 26 vertical fermenters of J and M Houses hold 70% of the production volume for the plant. Source: Google Earth
Measuring liquid level for all these fermenters is done using differential pressure (DP) transmitters. All the fermenters are sealed, and during normal operation, there is no venting to atmosphere. The headspace at the top of the tank feeds into a network of CO2 collection headers that can be isolated and vented to release gas at specific points. Most of the time, the fermenters are pressurized, and each has a rupture disk set to blow out at 2.5 psi to protect the vessel.
When using DP to measure level in a pressurized tank, the traditional approach is to connect the bottom of the tank to the high side of the transmitter, with a tap in the headspace at the top feeding an impulse line that is connected to the low side. This compensates for the tank headspace pressure and avoids reporting a level higher than actually exists. There are many variations of this approach based on how the impulse lines are handled (wet leg, dry leg, balanced, etc.), and the Milwaukee facility has tried most of them with varying degrees of success.
The most recent variation uses Rosemount Electronic Remote Sensors (ERS) from Emerson (Figure 2). This approach uses two transmitters, one at the bottom (primary) and one at the top (secondary), which are connected electronically through a digital cable. The primary transmitter takes the reading from the secondary transmitter, and makes the correction for the headspace gas pressure. It then sends a single signal to the distributed control system (DCS) that's proportional to DP and thus level. It's also able to send the headspace pressure reading independently via HART as an additional variable, and we’ll discuss how this data is used in a moment.
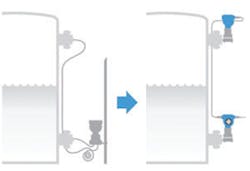
Figure 2: The Rosemount ERS system eliminates the impulse line connection between top and bottom of the fermenter and replaces it with an electronic connection. This provides additional valuable measurement data while eliminating maintenance issues often associated with impulse lines. Source: Emerson
The ERS system configuration eliminates all the problematic maintenance issues related to impulse/capillary lines, so this is a substantial improvement by itself, but it also delivers some critical advantages not possible with conventional setups that were tried previously.
Valuable carbon dioxide
As mentioned earlier, fermentation produces as much CO2 as ethanol by weight, and CO2 is a very valuable commodity in a brewery. It has to go through an extensive purification process to remove virtually all traces of oxygen before it can be used in production, but it’s important to collect as much CO2 as possible from the fermenters because it’s used in the packaging process, as well as for carbonation.
The facility does not produce as much CO2 as it needs, even under the best circumstances, so additional volumes of purified food-grade CO2 must be purchased. For brewers, this purchased gas represents a large fixed cost, so increasing internal production directly improves profitability, but improving CO2 capture can be complicated.
When a new batch of wort is pumped into a fermenter, CO2 production does not begin immediately. Some time is required for the yeast to start working, and enough CO2 has to be produced to drive all the air out of the headspace before collection begins. While this is happening, the gas and air mixture is vented to atmosphere. Once fermentation takes hold, CO2 collection begins, but it doesn't always happen at the same time with every batch. The standard procedure in the brewery was to wait a specific number of hours before collecting CO2 because there was no useful indication of when the yeast had hit its stride.
Since the ERS system allows access to the individual measurements from both sensors, we were able to read the pressure in the headspace. Having that reading helped us realize that CO2 production was beginning earlier than we thought, so we changed the procedure to begin collection when pressure reached a tipping point, which was often many hours ahead of the normally scheduled time. With a traditional DP system using impulse/capillary lines, this secondary measurement would only have been possible by adding another pressure transmitter.
CO2 production is also not uniform. It follows a curve from low to high and then back down, but the shape of the curve depends on the recipe, and can change from batch to batch because the action of yeast is not always predictable. Moreover, the CO2 collection and processing system has its limits and can be overwhelmed, raising backpressure in the headers.
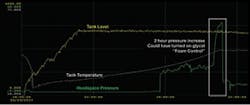
Figure 3: Pressure spikes caused by an unexpected jump in yeast activity are problematic if not caught soon enough.
The yeast acts more rapidly in some batches than in others, and in these cases, cooling must be applied to retard the action. Again, prior to installation of the ERS system, it was difficult to tell when the yeast might force the fermenter past its design working limit and blow out a rupture disk. When such an incident occurs, substantial amounts of CO2 are released to atmosphere from the individual fermenter and header system until the situation is discovered and the disk is replaced.
With the ERS system installed, it’s easy to determine when gas pressure is building up in the fermenter headspace (Figure 3). If CO2 production is increasing more than expected, cooling can be increased until it subsides, and vents can be opened if necessary to prevent blowing a rupture disk.
The overall costs related to overpressure and rupture disk problems is substantial, estimated at $65,000 annually in maintenance and lost CO2, so solving the problem was critical to improving profitability with minimal additional cost. The answer was provided by a simple level transmitter upgrade. The savings related to pressure issues and CO2 production were substantial, but a more significant opportunity soon emerged.
Determining the end of fermentation
When wort is first pumped into a fermenter, its specific gravity (SG) is high, raised by its glucose content. As the yeast does its work, the glucose breaks down, replaced by ethanol and expelled as CO2. Throughout the fermentation cycle, the SG of the beer drops. A DP level reading that does not compensate for this SG change will suggest the level has declined during fermentation when it has not changed at all.
Similarly, CO2 production slows and stops as fermentation reaches its end. The ERS system can recognize both events (Figure 4), and send corresponding data to the control room. By watching the output from the ERS system, operators can tell when fermentation is complete, and product can be moved from the fermenter into the aging tanks.
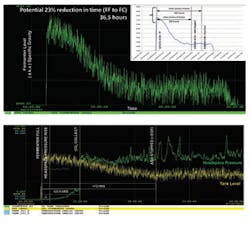
Figure 4: When the decline in specific gravity levels out and CO2 production stops, fermentation is done, regardless of what the schedule says.
Prior to installing the ERS system, fermentation was declared finished by the calendar. Each recipe called for a specific number of hours in the fermenter—no more, no less. Watching the actual fermentation performance of batches using the ERS system data suggested that CO2 production ceased and the SG stopped declining long before the schedule said it was done, often as many as 40 to 50 hours early. Could it be the beer was simply wasting time in the fermenter?
Lab tests of samples taken from multiple batches showed the beer was indeed ready to move to the aging tanks without waiting the extra time. With less time in the fermenter, more batches could be produced using the same equipment. This did not require any modification to the recipe or other artificial method to shorten the cycle, which could potentially affect the character of the final products.
Even taking a conservative view and projecting a time-per-batch saving of 10% adds additional production capacity of 400,000 bbl. per year to the existing J- and M-House fermenters. This represents free additional capacity with no new tanks or other processing equipment, but simply an improved level measuring system and the know-how to recognize the important information it’s providing.
For an optimization engineer, discoveries like these are what it’s all about. The ability to make a small but very strategic improvement to the instrumentation, and following it up with appropriate work process changes, resulted in significant improvements. Production gains made and opportunities for cost reduction can then be adapted for other facilities with the company seeing the benefits across each plant.
Andrew Klosinski, optimization engineer, works in the Brewing Department at MillerCoors.
