A structured approach to control system diagnostics

Control system diagnosis is an often-underused tool, and in the worst of cases, not used at all. But in the same way that a patient goes to the doctor for diagnostic tests to monitor their health, our industrial control systems should be routinely subjected to the same sorts of tests. These include custom alarms as well as system alarms and other diagnostic capabilities that the equipment has available by default.
Together, such diagnostics can help avoid progressive degradation of the control system, which could end in a partial process malfunction or—even worse—a safety incident or unwanted shutdown. To reduce the probability of such occurrences, prior analysis can help identify potential problems and needs; make efficient use of the available diagnostic capabilities; and monitor, maintain, improve and sustain the overall health of the control system over time.
The reliability and availability of a production plant’s control system—along with ongoing efforts to support its uninterrupted operation—are basic and foundational to the monitoring, supervision and control of production. And if one’s control system diagnostics are neglected or underutilized, that reliability and availability are at unnecessary risk.
Like any problem in life, technical or not, it's necessary to understand the situation in the most objective way possible, then analyze it and generate a plan. Subsequently, the plan must be implemented, results verified, and necessary corrective actions taken.
Assess your current situation
As an approach to understanding one’s current situation regarding the use and management of control system diagnostics, the following questions are raised:
- Are the available system diagnostic alarms (as defined in ANSI/ISA-18.2-2016) of the control system known?
- Are system diagnostic alarms of the control system attended to when they're activated?
- Is the maintenance of the control system predictive, preventive or reactive?
- Are all the diagnostic capabilities of the system used?
- Has the plant been impacted in any way due to failures in the control system?
- When a failure occurs, is it clear what to do? Where to look? What tools to use?
- Are fault resolution times usually long or short?
Reflecting on the answers to these questions—in the context of the type of industry, the production regimes and the particularities of each plant—describe the current use of control system diagnostics and response capacity to alarms and failures.
Analyze your needs
To perform the situational analysis, the inputs shown in Figure 1 are proposed. Central to the analysis are two important ANSI/ISA standards. “ANSI/ISA-95/IEC62264 Enterprise-Control System Integration” provides the framework on which the diagnostic system is to be applied, specifically on the hierarchical model of industrial processes, also known as the pyramid of automation. “ANSI/ISA-18.2-2016: Management of Alarm Systems for the Process Industries” is intended mainly for process alarms, but it provides key terminology and definitions applicable to system diagnostic purposes. The “alarm management lifecycle” proposed by ISA-18.2 is especially applicable for system diagnostic alarms as well.
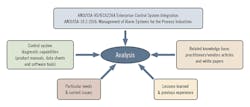
Figure 1: Inputs for situational analysis of your current control system diagnostics practices.
Control system diagnostic capabilities refer to those tools that the manufacturer provides to the end user, either software or hardware, for the diagnosis of its equipment. Examples of these are LED indicators, error codes, status bytes, network connection status, CPU usage, free memory, free disk space, algorithm error, internal temperature, input/output error, and any other diagnostic tool or system provided by the original equipment manufacturer (OEM).
Product data sheets, manuals and the OEM’s documentation in general provide useful information regarding maximum and minimum limits such as temperature, vibration, relative humidity and supply voltage. They also provide technical specifications such as amount of available user memory and CPU capacity. All these values help define alarm thresholds in the diagnostic system. Figure 2 lists the various elements to be diagnosed, within the framework of the functional hierarchy model of ISA-95.
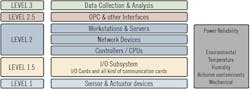
Figure 2: Control system elements to be diagnosed within the framework of the functional hierarchy model of the ISA 95 standard.
From a practical perspective, it's desirable to have previous work experience in automation systems and to have faced a range of failures in the past, as this will help define a direction for the system's diagnostic efforts, and provide elements of judgment for correct decision-making. However, when you don't have such experience, support your decisions by consulting related articles, whitepapers from manufacturers, end users, consultants and local and/or international standards organizations. Finally, reflect on current issues and needs specific to the production unit(s) in questions.
Implement new measures
Once the analysis is carried out and the equipment to be diagnosed is defined, the next step is implementation. Here are some premises and steps to take:
- For the devices of each hierarchical level, it's necessary to verify the diagnostic capabilities of each one, manufacturer's documentation, limit values to generate alarms, and related documentation as suggested at the analysis stage.
- In the plant, there must be at least one person responsible for the maintenance of the control system, its diagnosis, and the response to system and instrument diagnostic alarms and events that arise.
- Verify that the diagnostic alarms that come by default in the different devices and equipment are enabled.
- If necessary, generate custom diagnostic alarms that link the individual diagnostic alarms according to the existing architecture.
- Both default and custom control system diagnostic alarms must be segregated from the rest of the process alarms, as it’s effectively impossible to attend to control system diagnostics alarms in a timely manner when they’re mixed with other types of alarms.
- From an operations standpoint, if a diagnostic alarm doesn't need an operator response, it shouldn't be conveyed to the operator. On the other hand, if the diagnostic alarm requires an operator response, such as a maintenance work request, it should be configured according to a specific site alarm philosophy. (Check this technical report, "ISA-TR18.2.1-2018, Alarm Philosophy," for more details about alarm philosophy.)
- If the plant is medium-sized or large, it's advisable to segregate the diagnostic alarms by area to enable more effective responses.
- Create one or more graphical Health/Diagnostic dashboards, with displays consistent with “ANSI/ISA-101.01-2015, Human Machine Interfaces for Process Automation Systems.” Graphically represent the equipment and their interconnections in such a way that the system architecture is conveyed along with the relevant diagnostic alarms.
- Add alarm attributes, numerical values and animations that are relevant for viewing and listening. These measures, in conjunction with those described in preceding point, result in a valuable tool that conveys the state of the system at a glance (Figure 3).
- Consider dedicating at least one maintenance station to the handling of diagnostic alarms.
- If the number of diagnostic alarms is at first overwhelming, try exporting the alarms to a spreadsheet or other business intelligence software, and take steps to identify and eliminate any noisy, nuisance alarms.
- Make sure that maintenance staff, technical staff and operators (when applicable) understand the concept and the usefulness of the diagnostics dashboard, since a failure can occur on a Sunday morning and a quick response is vital.
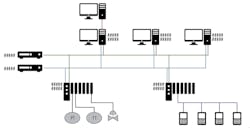
Figure 3: Structure your onscreen diagnostics dashboard to also convey the control system architecture.
Diagnostics by layer
With reference to the architecture layers indicated in Figure 2, here are suggested diagnostics for each.
Level 1—Smart instruments that feature digital communication protocols can alert to instrument degradation prior to failure. Capture these instrument diagnostic alarms through the control system or complementary instrumentation management system for timely response. Typical examples of these instrument diagnostic alarms include sensor failure, deviation alert, low air supply, maintenance alarm and out-of-range alarm, among others. (See ISA standard, “ISA 108 Intelligent Device Management,” and NAMUR recommendation, “NE 107 Self-Monitoring and Diagnosis of Field Devices,” for more details.)
Level 1.5—Verify input/output (I/O) subsystems and read their specifications. Take advantage of the available diagnostic alarms and, depending on the case, generate personalized custom alarms. For this level, apart from conventional I/O, fieldbuses and device networks also apply, so make use of available protocol diagnostics and communication watchdogs to generate custom alarms.
Level 2—As in the previous point, verify all the documentation and diagnostic capabilities of controllers/CPUs, network devices, operating stations and servers. Examples include available disk space, CPU free percentage, internal temperature, network connection and port overload, among others. At this level, it's very important to take actions needed to increase plant safety. For example, consider diagnostic and status information to activate interlocks when control system failures arise. Similarly, take action based on the status and diagnostics of regulatory control loop elements.
Levels 1 to 2—Monitor the uninterruptible power supply (UPS), ideally through a network cable via SNMP/Modbus TCP or other available communication protocol. (For power quality guidance, check the OEM specifications and the standard, “ISA-71.02-1991, Environmental Conditions for Process Measurement and Control Systems: Power.”)
Monitor the temperature, humidity and airborne contaminants in critical places such as the server room, and in general where electronic devices are located. For temperature and humidity reference values and guidance, check the OEM specifications and the standard, “ISA-71.01-1985, Environmental Conditions for Process Measurement and Control Systems: Temperature and Humidity.” Monitoring for airborne contaminants implies a more sophisticated measurement device than for temperature or humidity. However, for systems where the environment is aggressive, this aspect should be addressed. For more information about airborne contaminants, reference “ANSI/ISA-71.04-2013, Environmental Conditions for Process Measurement and Control Systems: Airborne Contaminants.”
Very high humidity favors corrosion and very low humidity favors the flow of static currents—and both affect electronic equipment. A very low temperature affects the resistive value of the conductors and resistors, while a very high temperature drastically degrades the equipment.
Note that the mean time between failure (MTBF) calculated by the manufacturer is based on a temperature of 25 °C; if temperatures are higher, the aging factor of the electronics accelerates and in turn reduces the MTBF. (Consult “MIL-HDBK-217, Military Handbook: Reliability Prediction of Electronic Equipment.”) Monitor the mechanical influences (vibration and shock) when needed. For mechanical influences guidance check the OEM specifications and the standard, “ISA-71.03-1995, Environmental Conditions for Process Measurement and Control Systems: Mechanical Influences.”
Level 2.5—If there are links between the control system and some historical or management software, such as a plant information management system (PIMS) or manufacturing execution system (MES), use the information that's available to verify that the connection is working correctly. Implement watchdogs and generate system diagnostic alarms if it isn’t.
Level 3—At this level, explore each particular application. Some examples include those for MES, laboratory information management systems (LIMS), PIMS, business intelligence (BI) and reporting tools, among others. Consider the use of data analytics to detect automation system problems, using principal component analysis (PCA) to eliminate cross correlations. Also, for continuous processes, consider projection-to-latent-structure (PLS) models to predict key process variables, realizing dynamic compensation of PCA inputs to predict a PLS output. Finally, enquire with a specialist whether or not a diagnostic from the control system is applicable or how the application can contribute to a better diagnosis.
Proper exploitation of system diagnostics can yield the following tangible and intangible results: improvement in the reliability and availability of the control system; decrease in degradation of the control system over time; decrease in potential plant shutdowns; visualization of system health at a glance; early detection of faults; quicker fault identification; increased safety and control; greater certainty about where to focus efforts; increased trust in the system by maintainers and by others; and, in the end, greater overall tranquility of operations.
Behind the byline
Luis Navas Guzmán is a process control engineer with Bayer Crop Science. Currently based in Argentina, he is an electrical engineer with 15 years’ experience in process automation across a range of industries in Latin America.
