Data Analytics in Batch Operations

By Robert Wojewodka and Terry Blevins
The trend in process plants design is to use continuous process operations, since they can often achieve higher production rates with lower capital expenditures. However, in many industries, one or more batch operations may be used in their manufacturing processes. Batch processing often is required when small lots of material are to be produced, or when the product is produced through chemical or biological reactions that take time to complete. For example, the specialty chemical and life-sciences industries depend heavily on batch processing to produce low-volume, high-value products.
The control logic used in batch processing is often complicated by the fact that multiple products may be produced using the same equipment. The wide range of operating conditions and changes in the process that effect dynamic behavior are often a challenge from a measurement and control standpoint. Often there are added challenges in assembling, cleansing and sequencing the necessary and sufficient data to conduct a thorough data analysis. Thus historically, the application of online analytics for fault detection and prediction in real time of the end-point value of quality parameters have not been addressed adequately. Yet these remain priorities for companies that use batch processing.
By design, each input to a batch process can potentially effect some or all of the measurements used with that piece of equipment. This interactive nature of the process, combined with the slow integrating response characteristic of many batch processes, makes it difficult for an operator to identify abnormal conditions in the batch and evaluate their impact on the final product quality. The fact that quality parameters are often not available as online measurements also complicates the operator’s job. Furthermore, the historical approach engineers have taken to understanding batch and continuous operations has been through simple reports, batch end-summary statistics and simple overlays of process trends. Although useful and informative, these approaches fall short of characterizing process variation and unraveling the multivariate nature of process relationships.
Over the last 10 years, significant progress has been made in the development of technology and understanding needed to apply online statistical analytics to batch processes successfully. Integrating such tools into a process control system can provide many benefits. As one moves forward in selecting tools for online analytics, it is helpful to understand many of the challenges of applying data analytics and the changes in technology that enable success.
Batch Production Challenges
Regardless of the industry, a great many plants use some combination of batch, continuous and semi-continuous processes, as illustrated in Figure 1.
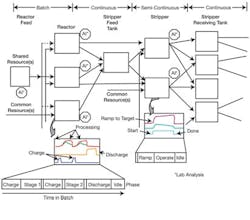
Figure 1. Many plants use some combination of batch, continuous and semi-continuous processes.
The batch unit-processing may be broken into one or more operations, depending on the product being manufactured. In the initial portion of a batch operation, the unit may be charged using discrete addition and/or by continuous feed, or some combination of discrete and continuous feed throughout the operation. Some of the inputs to the batch unit may be shared resources; others are dedicated to the equipment.
Feed rates and operating targets are determined by the target product and the operation of the batch. In some cases, multiple pieces of equipment may be available for processing a batch. Even though the equipment may appear to be the same physically, experience has shown that the performance of interchangeable units used for batch processing will often vary because of physical differences; e.g., heat exchanger area, capacity, valve characteristics, measurement location.
Within each batch operation, the material charged to the unit is retained within the unit and processed by a chemical reaction and/or mechanical means, such as heating, cooling and/or agitation. Once all material associated with a batch has been processed, the final product may be discharged to another unit for further processing or to a tank for storage. Lab analysis of some input feed streams may be available and may affect the charge rate and total charge to a unit. Quality parameters associated with the product may be available at the end of the batch or after a batch operation. The operator or the control system may use this data to correct the charge or the operating conditions used in the next phase of the batch operation.
There are significant differences in operating a batch process or a semi-continuous process and a continuous process. From a statistical analysis perspective, all continuous processes have batch aspects to them, and all batch processes have continuous aspects to them. In many cases, tools designed for continuous process analysis do not have features that are needed to address batch requirements effectively. In particular, some key areas that must be addressed to apply data analytics to a batch process successfully include:
- Process holdups. Operator- and event-initiated processing halts and restarts. Sometimes these halts and restarts are part of the batch process design, such as adding a special ingredient. Other times progression of a batch may be delayed by limitations imposed by the need to wait for common equipment to become available. Regardless of the initiating cause, the time to complete a batch operation may vary, which affects the way data must be processed during analytic model development and in the online application of analytics.
- Access to lab data. Due to the nature of the product produced by batch processing, online measurement of quality parameters may not be technically feasible or economically justified. Thus, it is common practice to take a grab sample and analyze it in the lab during various points in the batch process. In many facilities today, the lab data from grab samples may only reside within the lab system. The lab results may be communicated to the operator by phone or through a lab terminal that may not be tied to the control system. To implement online analytics, it is necessary for lab results to be available to the online analytics toolset.
- Variations in feedstock. The charge to a batch may come from storage tanks that are periodically refilled by upstream processes or by truck or rail shipments from outside suppliers. Changes in the incoming raw material properties may directly affect batch operation and quality parameters. Although the supplier may provide the properties of each material shipment, this data may be available only to purchasing or to the QA lab. If it is not available for use in online analytic tools, then this lack of information can affect the accuracy of predictions provided by the analytics.
- Varying operating conditions. A batch may be broken into multiple operations. The processing conditions may vary significantly with each batch operation and with the product that is produced by the unit. Thus, the analytic model that is applied to a batch should take into account the product that is produced and the operation that is active on the processing unit.
- Concurrent batches. Typically, most companies run concurrent batches in the same process cell. As soon as a piece of equipment is available, another batch is started. Companies do this to maximize throughput. Thus, multiple batches of the same material may be found within the unit at various stages of completion. The data collection and analysis toolset must work efficiently in that environment so each batch is analyzed and may be reviewed by the operator.
- Assembly and organization of the data. One of the limits that often prevents detailed analysis of batch processes is the inability to access, correctly sequence and organize a data set of all of the necessary data. This requirement must be fulfilled to analyze the process and move the results of the analysis online.
Advances in analytic technology over the last ten years make it possible to compensate automatically for varying operating conditions and for process holdups. Also, it is possible to compensate for feedstock property information and sampled lab data of quality parameters. However, such technology is not uniformly available in commercial analytic products. In nearly all cases, the integration of lab data and supplier information on the material properties of truck or railcar shipment properties is customized to each installation and, thus, not addressed by analytic tools. One of the reasons for this is that all of the business systems, lab systems and DCS control systems available today are designed very nicely for meeting their intended use, but not to help facilitate data integration and data analysis.
The “Golden Batch” or Iron Pyrite?
Some companies judge the status of batch processing by a standard set by the so-called “golden” or ideal batch. Typically, a golden batch is defined as the time-based profile of the measurement values that were recorded for a particular batch that met product quality targets. When using this standard, a batch is judged by how closely the golden batch profile is maintained though the adjustment of process inputs.
The term “golden batch” certainly has a nice sales and marketing ring to it, and many companies promote it. It is very easy to implement a comparative overlay of a current batch time-based profile with the single trace of the golden batch, and to the casual user, this approach may seem very logical. However, it is plagued with problems inherently.
The approach has two big weaknesses. First, conditions indicated by each measurement may affect product quality in a different manner. For example, it may be important to control some parameters tightly, while other measurements may vary significantly without affecting the product quality. Second, the “golden batch” is a univariate approach to a multivariate problem. There is absolutely no knowledge gained of the relationships of process variations. One simply emulates a single batch without knowing why, where or how this trajectory is good.
Without taking these and other key items into consideration, actions taken may incorrectly allocate resources, leading to incorrect control strategies. Time and money may be spent to improve control where it is not needed and directed away from where it is. Through the use of multivariate statistical techniques, it is possible to characterize variations both within and between batches and relate them to both process relationships and to predicting typical batch events and important end-of-batch quality characteristics.
PCA
One of the important multivariate statistical methods is principal component analysis (PCA). At the heart of PCA is the concept that a time-based profile for measurement values may be established using a variety of batches that produced good quality product and had no abnormal processing upsets. Analysis tools designed for batch analysis make it possible to extract, analyze and use data from multiple batches. For these batches, the normal variation in measurements is then quantified in terms of a PCA model. The model may then be used to develop a better understanding of how multivariate parameters relate to one another, and how these can affect the batch-to-batch costs, energy, waste and time needed to produce a product.
The model structure automatically takes into account that many of the measurements used in the batch operation are collinear; that is, related to each other and respond in a similar manner to a process input change. You can use the PCA model to identify process and measurement faults that may affect product quality. A problem is flagged only if a parameter deviates by more than the typical variation defined for a good product. As a result, the multivariable environment of a batch operation may be reduced to just a few simple statistics that the operator may use to assess how the batch is progressing. These statistics take into account the significance of a component’s variation from its established profile in predicting a fault.
Through the use of PCA, it is possible to detect abnormal operations resulting from both measured and unmeasured faults.
- Measured disturbances. The PCA model captures contributions of each process measurement to the normal process operation. Deviations in the process operation may be quantified through the application of Hotelling’s T2 statistic. Given an assigned level of significance, threshold values can be determined to detect an abnormal condition. The T2 statistic is a multivariable generalization of the Shewhart chart.
- Unmeasured disturbances. The portion of a process deviation that is not captured by the PCA model reflects changes in unmeasured disturbances. The Q statistic, also known as the squared prediction error (SPE), is a measure of deviations in process operation that are the results of unmeasured disturbances.
Through the use of these two statistics, it is possible for operators to determine fault conditions sooner in the batch, thus allowing corrections to be made to counter the impact of the fault.
PLS
Projection to latent structures (PLS)— also known as partial least squares— may be used to analyze the impact of processing conditions on final-product quality parameters. When this technique is applied in an online system, it can provide operators with continuous prediction of end-of-batch quality parameters. Where the objective is to classify the operation results into categories of importance (e.g., fault category, good vs. bad batch, etc.), then use discriminate analysis (DA) in conjunction with the PCA and PLS.
Through the application of data analytics, it is possible for the operator to monitor a batch operation simply by looking at a plot of the PCA statistics and the PLS estimated end-point value for quality parameters, as illustrated in Figure 2.
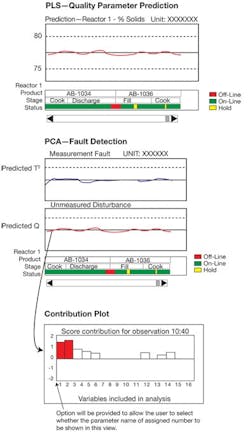
Figure 2. Operators can monitor a batch operation by looking at a plot of the PCA statistics and the PLS estimated end-point value for quality parameters.
As illustrated in Figure 2, the primary measurements that contribute to a process deviation may be displayed as contribution plots. These plots show how much each process variable contributes to the deviation and, thus, can help to determine the source of a measured or unmeasured disturbance quickly. Thus, when the current batch is evolving, if something deviates from acceptable variation relationships derived from the analysis of past batches, the operations staff may drill down into the process variables to understand why.
Analytic Tool Selection
The successful application of multivariate statistical techniques such as PCA and PLS depends in part on the toolset selected. Various techniques for PCA and PLS model development are used in commercial products. In some cases, a product may be designed to support the analysis of continuous processes. In such cases, data analysis and model development often assume that a process is maintained at just one operating condition.
To address the requirements of batch processes successfully, multivariate tools used for model development should be designed to address varying process conditions over a wide range of operation. Multiway PCA and PLS algorithms are commonly used in multivariate tools to address batch applications. Tools that support these algorithms are designed to allow a normal batch trajectory to be established for each process input and measurement automatically. In many cases, the toolset may only support off-line, post-production analysis. There is potentially much greater value in applying analytics online so that changes can be made in the batch to correct for detected faults or deviations in the predicted value of key quality parameters. The tools selected to implement online analytics should provide effective solutions to address the varying operating conditions and process holdups.
The PCA/PLS techniques applied in batch processing should account for the physical differences between interchangeable units, the product being produced and the operations associated with a batch. To provide this capacity, the PCA/PLS model should be stored and organized by process unit. For each unit, models may be organized by product and operation (See Figure 3).
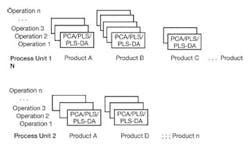
Figure 3. PCA/PLS models should be organized by process unit account for the physical differences between units, the product and the operations associated with a batch.
As the batch progresses through its operations to produce a product, the model that is associated with that product and operation should be used automatically in the online system. To facilitate the application of analytics to a batch process, the tools used for model development should allow historic data for batch operations to be accessed and screened by product and operation.
In some cases, collecting process data in a format that can be used by a given analytic tool is one of the greatest challenges in PCA and PLS model development. However, when those tools are integrated into control systems, it becomes possible for a manufacturer to provide information for each batch automatically. Three techniques have traditionally been used to unfold batch data for use in model development: time-wise unfolding, variable-wise unfolding and batch-wise unfolding. However, for online PCA analysis, a relatively new approach known as hybrid unfolding offers some significant technical advantages. (See T. Blevins & J. Beall. “Monitoring and Control Tools for Implementing PAT,” Pharmaceutical Technology, March 2007, supplement.)
The time required to complete one of more operations associated with a batch may vary because of process holdups or processing conditions. However, the batch data used in model development must be of the same time duration. There are many ways to achieve this. For example, to achieve uniform batch length, the data past a certain time in the batch could be simply be chopped off or compressed or expanded in some fashion to achieve the same number of time increments. However, a more effective approach is to apply dynamic time warping (DTW), which allows such variations to be addressed by synchronizing batch data automatically using key characteristics of a reference trajectory, as illustrated in Figure 4. (See M. Boudreau & G. McMillan, New Directions in Bioprocess Modeling and Control, ISA, 2006.)
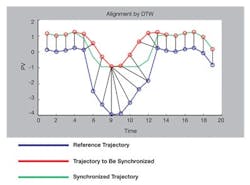
Figure 4. Dynamic time warping allows variations to be addressed by synchronizing batch data automatically using key characteristics of a reference trajectory.
Once PCA and PLS models have been developed using data from normal batches, their performance in detecting faults and predicting variations in end-of-batch quality parameters may be tested by replaying data collected from abnormal batches. Most commercial modeling programs provide some facility to test a model in this manner. More important is their performance in detecting faults and predicting variations in end-of-batch quality parameters in real time as current batches are evolving.
The Rouen Application
At Lubrizol’s Rouen, France, facility, we’re putting these ideas to the test. We are applying online analytics to batch processes for fault detection and prediction of quality parameters. This application in the specialty chemical industry contains many of the batch components commonly found in industry. We are using an analytic toolset collaboratively developed by Emerson and Lubrizol for this installation. It is specifically designed for batch applications and incorporates many of the latest technologies, such as DTW and hybrid unfolding. However, as with any engineering endeavor, the success of the project depends greatly on the steps taken in applying this analytic technology.
To address this application, we have formed a multi-discipline team including the toolset provider and experts from Lubrizol’s plant operations, statistics, MIS/IT and engineering staffs. In the future, the approach we are using at Rouen will be further refined and followed for other applications. Therefore, we are giving considerable thought and effort to project planning to achieve an installation success. The project steps are summarized below.
Collect Process Information. The measurements and the batch operations definitions for the production of various products is unique to each installation. To apply data analytics to a batch process, the team doing this work must have a good understanding of the process, the products produced and the organization of the batch control. Existing documentation on the process and the batch control were distributed to the project team for study. We held a meeting to allow operations to provide the team input to become more familiar with the process. Based on this information, we created a list of the process measurements, lab analysis and truck data for raw material shipment. This formed the basis of what Lubrizol refers to as the Inputs–Process–Outputs data matrix. This information defines the data that will be considered in the PCA and PLS model development.
Instrumentation and Control Survey. A basic assumption in the application of analytics to a batch process is that the process operation is repeatable. If there are issues associated with the process measurement or control tuning and setup, then these should be addressed before data is collected for model development. Thus, in parallel with the initial project meeting, an instrumentation and control survey was conducted for the two batch process areas addressed by the project. Any instrumentation problems found in the survey were corrected. Also, changes in loop tuning were made to provide best process performance. For example, the temperature and pressure loops associated with three reactors were retuned to provide improved, repeatable performance.
Integration of Lab Data. Key quality parameters of the batch operation at the Rouen facility are obtained by lab analysis of grab samples. Typically the lab analysis data is then entered by a company into its enterprise resources planning (ERP) system (SAP in the case of Lubrizol) and is used for quality reporting, generating certificates of analysis and in process improvement studies. The properties analysis for truck shipments are also entered into the ERP. To allow this data to be used in online analytics, the team created an interface between Lubrizol’s SAP system and the process control system.
The material properties associated with truck shipments are used to calculate the properties of material drawn from storage—inputs used in the PCA and PLS analysis. Thus, it is important to characterize both the quality characteristics of incoming raw materials and the quality of end-of-batch characteristics.
Historian Collection. When the process control system was originally installed at the Rouen plant, all process measurements and critical operation parameters associated with the batch control were set up for historian collection in one-minute samples using data compression. However, for the purpose of analytic model development, it is desirable to save data in an uncompressed format. Thus, additional historian collection was defined for the measurements, lab data and batch operation data. This information is collected using 10-second samples and saved in uncompressed format. This allows the data analysis in a finer time resolution and also allows further definition of a more appropriate resolution for future implementation. Later, analysis of the data will determine if the resolution needs to remain at a fine resolution, or if it may be reduced.
Model Development. The tools for model development are designed to allow the user to easily select and organize from the historian a subset of the data associated with parameters that will be used in model development for a specified operation(s) and product. The tool provides the ability to organize and sequence all the data into a predetermined data file structure that permits the data analysis. Once a model has been developed, it may be tested by using playback of data not included in model development. Since the typical batch time is measured in days, this playback may be done faster than real time which allows the model to be evaluated quickly for a number of batches.
Training. The statistics provided by online analytics will be used primarily by the plant operator. Thus operator training is a vital part of commissioning this capability. Also, separate training classes on the use of the analytic tool will be conducted for plant engineering and maintenance personnel.
Evaluation. During the first three months of the online analytics, operator feedback and data collected on improvements in process operation will be used to evaluate the savings that can be attributed to analytics. It will also be used to obtain valuable input to improve the user interfaces, displays and the terminology used in the displays. This will allow the project team to improve the analysis modules further to maximize operators’ and engineers’ use and understanding.
As shown by these project steps, most of the time required to apply online analytics is associated with collecting process information, surveying instrumentation and control, integrating lab data, setting up historian data collection and training. When the analytic toolset is embedded in the control system, it will reduce the effort required to deploy the online analytics. A well-planned project and the use of a multi-discipline team will play a key role in the installation success.
Conclusion
In short, the use of statistical data analytics will likely cause people to think in entirely new ways and address process improvement and operations with a better understanding of the process. Its use will allow operations personnel to identify and make well-informed corrections before the end of batch, and it will play a major role in ensuring that batches repeatedly hit pre-defined end-of-batch targets. Use of this methodology will allow the engineers and other operations personnel to gain further insight into the relationships between process variables and their importance in affecting product quality parameters. It also will provide additional information to help guide process control engineers to pinpoint where process control needs to be improved.
Robert Wojewodka is technology manager and statistician with the corporate operations department at The Lubrizol Corporation. Terry Blevins is principal technologist at Emerson Process Management and a member of the Process Automation Hall of Fame.
Hear a podcast about this article with the
authors and Control Editor in Chief Walt Boyes at www.controlglobal.com/articles/2007/321.html.
Multivariate Statistics 101
Principal component analysis (PCA) enables the identification and evaluation of product and process variables that may be critical to product quality and performance. Equally important, this tool may be used to develop an understanding of the interactive relationship of process inputs and measurements and online, inline, or at-line analysis of final product. When applied online, PCA may be used to identify potential failure modes and mechanisms and to quantify their effects on product quality.
Multiway PCA (MPCA) is an extension of PCA and provides a very effective means of accounting for and aligning batch data (i.e., different batch lengths). Using MPCA, engineers can apply data-intensive technologies and extract exact information in order to monitor conditions and also relate conditions to faults in batch processes.
Projection to Latent Structures (PLS), sometimes referred to as partial least squares, may be used to analyze the impact of processing conditions on final product quality parameters that are often measured using online, inline, and at-line analysis of final product. When PLS is applied in an online system, it is possible to provide operators with a continuous prediction of end-of-batch quality parameters. PLS is also effectively used with PCA so that only the important process variation is identified in PCA to minimize false alarms of variation that may be present, but not meaningful.
Discriminant Analysis (DA) is related to PCA and other statistical analysis methods, such as analysis of variance. It is oftentimes used in conjunction with PLS as a powerful technique. Discriminant analysis is used when one is relating process variation to categorical or classification criteria as opposed to a continuous output measurement. Examples of a categorical classification may be something as simple as the batch being “in specification” or “out of specification,” or as complex as many different categories representing abnormal situations in the batch or other categorical classifications of quality or economic parameters.
Dynamic time warping (DTW) algorithms effectively measure the similarities between two sequences that may vary in time and/or speed. The method then adjusts for these differences so that multiple batches may be combined together into one data set so that the batches may be analyzed.
