Sizing and checking equal-percent control valves
Q: The control valve's actual operating conditions are compared with the design values. It's a 10-year-old equal-percent control valve. Installation and testing data is included in the accompanying graphics. The control valve outlet piping is around 2.0 m vertically upward, connecting to the nozzle entering the distillation column. The check valve is functioning and the gate valve is fully open. There's also no pipe clogging issue. As the operating flow rate is only 60% of the control valve maximum flow rate, it's expected that the actual control valve percentage opening will be lower than the reading from DCS. As there's no high dP expected at the control valve outlet piping, where does the excess dP go? Could there be a high chance that the control valve's design or actual characteristics are wrong? Based on the current actual operating scenarios, does this mean the control valve will no longer be controllable in the future when the plant is operated at 70% of maximum control valve flow rate, i.e., the expected control valve could be 100% open? I suspect that the control valve might not be correct, and I have no clue what went wrong. Nevertheless, it seems that it could not be that all four control valves, which had been there for 10 years, are operating and not meeting the original valve design specifications:
- A linear inherent curve will in general resemble a quick opening characteristic, and
- An equal percentage curve will in general resemble a linear curve.
Seer Ping
BTech, Chemical Engineering
[email protected]
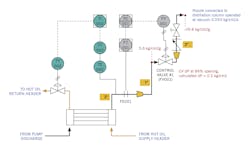
A1: This long question illustrates how not to ask a question because it says a lot, but leaves out the key data. It involves the operation of an equal percentage (= %) feed flow control valve on a vacuum distillation column which is operating at -0.98 kg/cm2g vacuum (Figure 1).
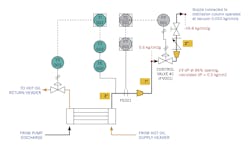
Also tabulated are the conditions the valve was sized for 10 years ago, including the actual flow and inlet pressure that exists today (Figure 2). The questions are: can this = % valve handle a 10% increase in flow and why did the inlet pressure increase three-fold over the years?
Question 1: Let me start with a brief description of the nature of = % valves. In my experience = % valves are the wrong selection flow control application. I use = % valves only for heat transfer control and use linear valves for regular flow control and quick opening for square root type flow control.
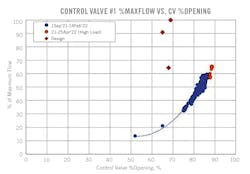
With an = % valve, as the lift rises, each percentage of lift results in a different amount of flow increase. This increase amounts to a fixed percentage of the flow at that point. This increase is 3% in your case. Therefore, if this percentage also applies at 50% flow, lift is about 80%. In other words, if today you operate at 50% of maximum flow, then your lift today should be about 80% and you would double the flow when the lift is 100%.
Naturally, this is only true, if ΔP is constant. At the time of sizing, ΔP was 1.43 kg/cm2g, and you didn't state its value today. Therefore, if over the years ΔP remained constant, the = % valve would be OK when the flow increases by only 10% (from 50% to 55%). On the other hand, if the valve ΔP changed over the years, the valve characteristics also changed. I don't know if it did or not because in the long list of that data, you didn't provide this key information. When the valve is installed in piping, the valve characteristic is no longer independent because it will also be affected by the frictional resistance of the rest of the system. In such cases (which is yours), if your pump is constant speed, the valve characteristics can be distorted towards linear or even quick opening. If your pump is variable speed, the distortion will be less. Regarding the somewhat complicated calculation of the distortion coefficient, refer to Chapter 6.7 in my handbook.
Therefore, the answer to your first question is that, if the valve ΔP didn't change over the years, it can operate at a 10% increase in load.
- If the fluid viscosity increased (and therefore the Reynolds number was reduced), the flow profile could have shifted from turbulent towards laminar.
- If material built up on the inside surfaces of the system and this restriction reduced the area open to flow, the resulting resistance could also have increased the inlet pressure (Pi).
- Pi could have also risen if the fluid temperature (T) increased above the boiling point (Tb) of the fluid, because when liquid is turned into vapor by flashing, the volume can increase hundred-fold.
So, the conclusion is you can provide a lot of text and data, but if it doesn't contain the key information (in this case outlet pressure and boiling temperature), then you can't get a firm answer.
Béla Lipták
[email protected]
A2: On Aug. 9, 2003, I checked the derivation given by Smith and Corripio, Automatic Process Control, pp. 147-154, and found it to be correct. On one occasion, a field test with measurements was done by an independent instrument engineer on an online control valve, and it proved that the information in the mentioned text was valid. The information was then shared with my former company.
Yes, a linear valve will approach quick-opening characteristics and an equal percentage curve will in general resemble a linear curve, as the lift increases. However, a control valve with a strong, stiff, well-built and well-packaged actuator can produce an observed flow characteristic matching exactly with the designed flow characteristic of the engineered control valve. The latter information wasn't captured or mentioned in the text by Smith and Corripio.
Gerald Liu,
Consultant, Voting Member, ISA 75
[email protected]
About the Author

Béla Lipták
Columnist and Control Consultant
Béla Lipták is an automation and safety consultant and editor of the Instrument and Automation Engineers’ Handbook (IAEH).
