How fragile is your plant?
We as an industry have done an excellent job ensuring that our safety instrumented systems (SIS) provide the risk reduction calculated in our risk assessments. Other improvements in functional safety have further reduced the potential for accidents. Yet we're still having them.1
A more holistic approach called the superimposition accident model,2 together with the concept of plant safety “fragility”3, has the potential to help improve our overall safety performance.
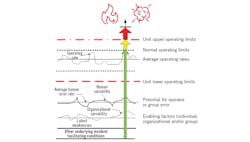
Sometimes incidents happen because many varied things align together in a perfect storm. Certain conditions, states and actions superimposed on one another can increase the likelihood of an incident. Conversely, other conditions, states and actions superimposed on one another can decrease the likelihood of an incident.
This concept is illustrated in Figure 1. What should be noted is that, while the presence of conditions, states and actions may be required for a negative outcome to occur, they're not necessarily sequential or linear in nature. So, while individual human error or actions may lead to an accident, there are quite likely underlying conditions and states that facilitated the occurrence of those errors. The same type of inference applies to positive outcomes: if weaknesses are changed into strengths, the likelihood of an incident can be reduced.
Plant safety fragility
Safety incidents are seldom simple, nor do they occur in a vacuum. Most incidents have a number of conditions, states and actions that led to or facilitated the incident. When looking at the individual elements probabilistically, e.g. multiplying probabilities together, it's sometimes hard to see how an incident could have occurred based on probability alone.
I came to the conclusion some years back that many incidents have a combination of unrecognized background states, conditions or enabling factors that were essentially lying in wait for the right actions or events to occur, which when combined, resulted in an incident. This is essentially an application of the superimposition principle, i.e. actions, states, events, factors and conditions when overlaid, add up to exceed an “accident threshold."
Figure 1 illustrates the superimposition model of an incident where underlying system-level conditions, human error, equipment failure and current operating rates push the system closer to exceeding the plant limits, leading to an incident. The closer the system safety profile is to the hazardous regime, the more fragile a plant's safety is. When certain conditions or actions (called safety stressors) are combined with current plant safety weaknesses, the plant safety profile moves in the direction of the hazardous regime and the likelihood of an incident increases.
The current process safety methodologies (HAZOP/LOPA) are scenario-based, and provide a “small picture” look at safety by identifying individual hazardous scenarios (small pictures) that can lead to an incident. The methodologies assume that by mitigating a large number of scenarios, plant safety (the big picture) can be improved.
Scenarios are developed by breaking down the process into smaller pieces called nodes, and applying guide words such as too much flow or too little flow to identify initiating causes that could lead to a negative outcome. The frequency of occurrence of the initiating cause and the consequence of each scenario are evaluated. Independent layers of protection (IPLs) are then applied to reduce the frequency of occurrence or to mitigate the consequence to an acceptable level. These methodologies do not typically look at why and how the initiating causes occur, nor do they try to reduce the initiating cause frequency of occurrence, or examine what plant systems or conditions facilitate the occurrence or the subsequent progression of the hazardous scenarios. This is a valid approach as far as it goes, but it's limited to a set of identified potential hazards out of an unknown set of hazardous scenarios.
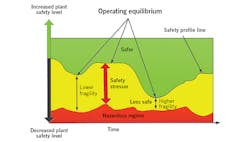
Figure 2: The safety profile or operating line indicates the current level of safety under the current operating conditions (green area) and the hazardous regime (red area). The distance between these lines is a measure of a plant's safety fragility.
Big-picture perspective needed
Essentially, this functional safety approach doesn't look at the bigger pictures that may facilitate the littler ones. Instead, these process safety methodologies should be used together with an effort to identify safety weaknesses at the individual, intermediate and system levels, so they can be strengthened, thus reducing the potential occurrence of negative outcomes. To do this, safety weaknesses (fragility) as well as strengths in the plant systems must be evaluated, and the system must be strengthened to eliminate or significantly reduce the level of safety weaknesses.
The safety fragility concept from an operating perspective is illustrated in Figure 2. Here, the safety profile or operating line indicates the current level of safety under the current operating conditions (green area) and the hazardous regime (red area). The distance between these lines is a measure of a plant’s safety fragility. Unlike in the figure, however, fragility is multi-dimensional: there can be multiple points in an operational regime or plant where weaknesses under the right conditions can add up to an incident.
The safety profile line in Figure 2 indicates a combination of conditions, operating states, system responses, current events and actions, internal and external forces, and variations in the plant hazardous operating regime over time. Time is a necessary consideration as safety can vary over the day, time of the month, or time of the year, as well as with market conditions. For example, the competency to deal with abnormal conditions can vary from shift to shift, and things may be more dangerous in the winter or summer or under certain product slates. These variations can significantly affect plant safety fragility.
If, on the other hand, the safety profile line starts to go further up into the green area in Figure 2, the plant safety level will have improved relative to the hazardous regime. And if the safety profile line moves down into the yellow area, safety fragility has increased. If the safety profile line enters the red area, the red area crosses into the green zone, or a stressor occurs to push the profiles together, a safety hazard or incident can potentially occur.
A plant is essentially a large, complex system in a state of safety equilibrium during normal operation, where safety is neither increasing nor decreasing. The system stays in the equilibrium state until some event or condition (a safety stressor) disturbs the equilibrium state. A safety stressor can be defined as a condition or state, event or action that moves the safety profile line and the hazardous regime closer together, increasing the likelihood of an incident. Strength and resilience resist the safety stressor while weakness facilitates the safety stressor.
| Number of loss-containment events per month/year |
| Number of near misses per year |
| Monthly number of abnormal operational events |
| Number of annual safety demand events |
| Average plant operator experience level |
| Average shift experience level |
| Average plant maintenance technician experience level |
| Average engineer experience level |
| How long is your maintenance bad actor list? |
| Number of monthly operator mistakes due to poor situational awareness |
| Number of mechanical integrity and reliability events that affected plant operations |
| Number of outstanding SIS proof tests |
| Number of control system or instrumentation loops that are in manual or are non-functional |
| How many mechanical integrity inspections occur monthly/annually? |
| What are the operator and maintenance technician's impressions of plant reliability and mechanical integrity? |
Factors affecting fragility
Functional safety has given us a necessary level of protection while the concept of fragility leads us to a different perspective that also looks more holistically at system-level aspects of safety in a plant. Some of these factors include plant and company safety leadership, safety culture and climate, personnel competency and experience, system strength and resilience, operational and maintenance discipline, inherent safety and plant design, current physical shape of the facility, mechanical integrity and reliability4,5, as well as data quality (situational awareness)1. This is by no means a complete list of system-level properties, states or conditions that affect safety and fragility. Each company and plant will have its own unique system-level properties that affect fragility.
The length limitations for this article prevent a more detailed discussion of these items. My recent Texas A&M Instrument Symposium presentation3 discusses these items in some detail, including potential key performance indicators (KPIs), conditions and questions to be asked about the current state of the plant.
ANSI/API 754, “Process Safety Performance Indicators for the Refining and Petrochemical Industries” represents KPI for recognized and generally accepted good engineering practices (RAGAGEP) when it comes to process safety, and should be referred to when starting to determine a plant’s safety fragility. Many of these KPIs are handled at the local or intrinsic level but not always at the system level or perspective in a typical plant. For example, experience may be examined at the group level but less so at the system level. While KPIs can help provide a measure of existing plant fragility, KPI trends are also important as they can indicate whether plant safety is getting stronger, weaker or steady. Some example KPIs are listed in Table I.
Quantitative calculation of fragility as a single variable is difficult due to lack of a mathematical methodology, as well as a lack of comprehensive metrics or weighting factors. Some aspects of fragility are qualitative in nature, making it more difficult to quantitatively combine disparate metrics to achieve “uber” KPIs indicative of overall safety fragility.
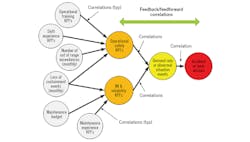
Figure 3: System-level KPIs may show a plant's underlying weakness in one area such as lack of competence or experience, but correlating them to other KPIs that are indicative of the hazardous regime—such as high demand rate, number of abnormal situation events, number of relief valves lifting or number of near misses or incidents—can indicate what things are strong negative influencers. The reverse can also be true, as changes in KPIs can indicate strengthening of plant safety and reduction in the plant's safety fragility.
Calculating fragility
One obvious approach is to collect data for KPIs that can potentially affect the “strength” or “weakness” of a plant. This methodology will be data- and analytics-intensive, but because a lot of the data is available, it will help provide quantitative results. In addition, data mining may yield additional useful information.
Looking at individual system-level KPIs may show a plant’s underlying weaknesses in one area such as lack of competence or experience, but correlating them to other KPIs that are indicative of the hazardous regime—such as high demand rate, number of abnormal situation events, number of relief valves lifting or number of near misses or incidents—can indicate what things are strong negative influencers. The reverse can also be true, as changes in KPIs can indicate strengthening of the plant and a reduction in the plant’s safety fragility. For example, increases in operating experience may correlate with a decrease in plant SIS demand rate. It may also be that weakness vectors indicative of increasing fragility prove additive in nature. A simple example of these types of fragility vectors is shown in Figure 3.
How can we combine these complex KPIs in a useful manner? One approach may be weighted averages based on statistical correlations that are fed back as operating time progresses using data analytics to indicate what influences what and to what extent. Another possible approach is the use of a recursive neural network to determine the effects of various KPIs on potential negative and positive outcomes.
Complementary approaches
Current hazard and risk assessment methodologies look at multiple hazardous scenarios (small pictures) to individually reduce the frequency or mitigate the effect of the scenario’s consequence. But determining all the possible hazardous scenarios (bigger picture) out of an unknown set of hazardous scenarios limits this methodology.
Fragility, on the other hand, looks at the plant’s systems and intermediate-level safety weaknesses and strengths as well as some of the system-level elements common to all scenarios, such as reliability, human error and mechanical integrity. It looks at the bigger picture, and seeks to reduce the plant’s safety fragility, improving safety. These methods are complementary—not alternative—approaches.
The purpose of looking at a plant’s fragility is to realize that process safety is more than reducing the frequency or consequence of hazardous scenarios by applying functional safety. While functional safety significantly contributes to plant safety, it is not sufficient unto itself. System-level causal factors that facilitate unsafe actions and conditions that lead to an incident must also be considered and the plant’s systems strengthened to increase the plant’s overall level of safety.
Since a plant’s safety fragility is a combination of many things, a holistic approach is necessary to consistently keep the safety profile well away from the hazardous regime. This can be done by building strength and resilience into plant systems, reducing the system facilitation of safety stressors, limiting the events or underlying conditions that can unknowingly drive the operating profile toward the hazardous regime, and shrinking the hazardous regime itself.
References
- “Beyond Bhopal,” William L. Mostia, Jr. PE, Control, August 2015.
- “Why Bad Things Happen to Good People,” William L. Mostia, Jr. PE, 2009 MKOC Safety Symposium, Journal of Loss Prevention in the Process Industries 23 (2010), pp 799-805.
- “How Fragile is your Plant?” William L. Mostia, Jr. PE, 2019 TAMU Instrument Symposium for the Process Industries.
- “Process Automation Reliability vs. Safety,” William L. Mostia, Jr. PE, Control, April 2014.
- “Design for safety instrumented systems reliability,” William L. Mostia, Jr. PE, Control, May 2017.
Frequent Control contributor William (Bill) Mostia, Jr., P.E., is principal, WLM Engineering, and can be reached at [email protected].
