Justify improved control via process economics
Key Highlights
- True improvement in control also depends on instrumentation quality, process design and strategic system enhancements—not only control algorithms.
- Physical or mechanical changes can greatly improve stability and product quality, but they require economic justification.
- Managers need evidence of value based on ROI arguments rather than purely technical reasoning.

Control technologists know that advanced regulatory control (ARC)—cascade, ratio, feedforward and nonlinear strategies—can improve control. Their advantages include increased throughput, reduced energy consumption, improved quality, less waste, better operational efficiency, increased yield, fewer quality giveaways and better safety margins. However, the scope of a control engineer is much wider than control strategies.
Improvements in instrument systems can also improve control. These include selecting the right instrument for the service, relocating measurements to shorten delays, improving resolution with faster processers, developing mathematical process models of the process, inferential measurements, and linearizing model transformations.
Process changes can also improve control, such as increasing tank levels to increase inline blending, placing positioners on flow control valves to prevent stiction, or removing assignable causes that periodically upset the process. Some of these improvements require more investment, and require economic justification.
Improved control is an abstract concept. Process improvements are often justified by return-on-investment (ROI). How can you forecast the economic benefits of improved control to justify a project, and assess the economic benefit in a post-implementation audit? How can you provide a comprehensive evaluation that includes resistance to upsets, ease of maintenance or safety? One solution is to preview improvements using a digital twin—a mathematical model of the current process validated with experimental data, which we can use to test the proposed control system.
Managers are risk-averse, skeptical and need to be convinced that proposed actions won’t result in safety issues, complaints by operators, or maintenance issues for operators. What we might call an improvement could seem to them like a newfangled complexification. Managers are concerned that a person with a hammer thinks everything looks like a nail. So, how can they be convinced that a proposed control improvement isn’t just a skill the technologist wants to show off? Demonstrate the value of your proposed improvement using objective arguments based on metrics they understand, like ROI.
How to assess benefits of improved control
Improved control results in less variation in the controlled variable, which permits operating closer to constraints, higher throughput and/or less energy consumption, and ultimately more profit. There are several ways reduced variance can permit operating changes that improve the bottom line. Here are descriptions of two concepts:
Quality giveaway
We want to operate as near as possible to product specifications or operating constraints. However, if the controlled variable (CV) deviates from the setpoint, then the setpoint must be moved away from the constraint to prevent violating specs or contraints.
Figure 1 illustrates pressure control over time. The constraint is the upper, horizontal, dashed line, which might be related to equipment operating limits. For process efficiency, we may operate a distillation column nearer to the equipment pressure limit to get improved separation, and permit lower boil-up rates for the separation, which means less energy consumption.
Get your subscription to Control's tri-weekly newsletter.
On the left side of the figure, the setpoint (solid horizontal line) is below the constraint to prevent deviations on the CV (the noisy signal) from exceeding the constraint value. On the right side of the figure, improved control reduced the variation on the CV. As a result, the setpoint can be moved nearer to the constraint, and still prevent violations.
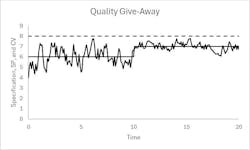
The setpoint deviation from the limit is termed quality giveaway. Though the illustration represents pressure, CV can be many variables. If CV is an impurity in the product, the producer must give the customer higher quality product than necessary to prevent specification violations. This is why it’s called a giveaway. Excess purity means higher raw material costs and/or more expensive processing—perhaps related to more energy use in distillation, more residence time in a reactor, or more chemical treatment to separate the impurity.
Though Figure 1 represents pressure control, we still call it quality giveaway.
Regardless of the CV, given the reduction in variability, the process engineer can use process models, intermediate product and utility values to estimate the value of the setpoint change related to reduced variation. A question remains about how to estimate reduced variability from a control or instrument improvement. An answer is coming, but first consider a second process improvement method.
Flooding
One type of flooding in a distillation column happens when a high-velocity, vapor upflow entrains liquid droplets, carrying them back up the column instead of letting them fall by gravity. The more liquid entrained, the less upflow area, increasing the vapor velocity and exacerbating the entrainment effect. Eventually, the liquid can’t fall through the column, and it floods with liquid. The vapor mass flow rate that causes flooding has a square root response to column pressure.
To increase production rate or purity, the vapor flow rate must increase. However, the mass flow rate of the vapor is limited by the flooding point. Typically, operation is kept safely below the flooding point, so process disturbances or imperfect control don’t cause flooding.
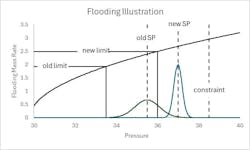
Figure 2 illustrates the pressure-to-flooding vapor rate relation and the limit on column pressure. The square root-shaped curve indicates how the vapor-mass rate that causes flooding (the maximum permissible vapor rate) depends on column pressure. The right-most, vertical, dashed line at a pressure value of 38.5 is the pressure constraint on the equipment, and for a small safety margin, we don’t want the pressure to exceed 37.5.
The left-most, vertical, dashed line represents the old pressure setpoint, and the bell-shaped curve on the bottom, centered on the old SP, is the old, operating column’s pressure distribution. Since the column pressure is variable, the setpoint must be adequately below the 37.5 limit, so the maximum pressure deviation doesn’t violate the safe value. Roughly, the setpoint needs to be 3-sigma below the 37.5 limit, which is why the old pressure SP is at 35.5. Notice that the variation in pressure permits a low pressure of about 33.5, and this pressure determines the flooding velocity, while the old vapor rate is labeled as “old limit.”
If a control improvement permits lower pressure variation, then the pressure setpoint can be moved closer to the constraint. Note that, at the new SP with reduced variation, the maximum pressure doesn’t exceed the limit of 37.5. Also note, at the “new SP,” the minimum pressure is now about 36, which defines the new upper limit on the vapor rate. In this illustration, improved pressure control permits about a 25% increase in vapor rate, which translates to increased productivity for a given purity (additional profit) or increased purity for a given production rate (higher-priced product grade).
Reduced pressure variation can lead to diverse other benefits, such as those related to pressure constraints on equipment or thermodynamic separability.
I greatly appreciate input on this article from Sandeep Lal, senior process control and optimization engineer at Chevron Phillips Chemical Co. LP, as well as Luis J. Yebra of the Centre for Energy, Environmental and Technological Research (CIEMAT) on simulation and control projects, which is partly supported by the Spanish Ministry of Science and the European Union.
About the Author

R. Russell Rhinehart
Columnist
Russ Rhinehart started his career in the process industry. After 13 years and rising to engineering supervision, he transitioned to a 31-year academic career. Now “retired," he returns to coaching professionals through books, articles, short courses, and postings to his website at www.r3eda.com.

Leaders relevant to this article: