Can we reliably measure the rate of rise of global warming at 0.01°C/yr?
During the question-answer period after a lecture in which I discussed the critical role that our profession should play in converting the present fossil-nuclear energy economy into a zero-carbon, green energy economy, one colleague asked: "Can we reliably measure the rate of rise of global warming at 0.01 °C/yr? In my experience, the best accuracy I've ever obtained was around ±0.1 °C. How can that accuracy be increased tenfold?”
Before answering that question, let me note that the coronavirus effects will be over in a year or two, while the global warming we reach and its effects will be with us for centuries, and it will not be fixed by face masks.
As to measurement accuracy, I will first describe the heat balance process of our planet. The global temperature at any one time is a function of the difference between the energy received from the sun and the energy radiated back into space. When the energy radiated back into space is less than the insolation received, the planet will absorb the difference and will warm. Because of the immense mass of the Earth, this warming will be very slow, its rising will be delayed, but will continue for a long while, even after the incoming and outgoing heat return into balance.
If we had no atmosphere, our planet could not support life because the heat loss (or gain) would result in a Moon-like climate on the Earth's surface. When sunlight hits the Moon's surface, the temperature can reach 260 °F (127 °C), but when the sun goes down, temperatures dip to -280°F (-173°C). On Earth, this is prevented from happening because the greenhouse gases in the atmosphere block this radiation from leaving and reradiate this heat back to earth.
Today, we receive 342 W/m2 of solar energy—a total of 5 million Quad (Q=1,015 BTU) per year. Of this, around 70% is absorbed by the planet and 30% is reflected back into space. During the last century—due to human activity—the incoming energy exceeded the reflected outgoing energy by 1.6 W/m2 (24,00Q/yr). This extra energy is an immense quantity, and causes anomaly or radiative forcing (RF) of the earth, otherwise known as global warming. To appreciate the size of this extra energy, we should realize that it exceeds the total yearly energy consumption of mankind (600 Q/yr) by some 40-fold. Another way to describe the magnitude of this energy imbalance is its equivalence to several Hiroshima bombs every second.
93% of this extra energy is absorbed by the oceans, and this results only in a yearly sea temperature rise of around 0.015 °C/yr. In other words, while the global RF is gigantic, when it's added to the oceans, the resulting temperature rise is small. Put another way, a very small rise in the temperatures of the oceans is caused by the absorption of immense quantities of heat.
Global warming is caused by the increase in the total RF of the planet, which varies with the location, the year used as zero reference, the season and most importantly by the difference in the accuracy of the measurements by the different teams of scientists that collected them. I will not bore you with numbers, but will only mention that the temperature of the earth increased from about 57.8 °F (14.1 °C) in 1905 to about 59.2 °F (15.1 °C) today, yielding an average rise of about 1.0 °C (1.8 °F). In February 2020, the earth’s average temperature was a near-record 2.11 °F (1.17 °C) above the 20th century average. The tabulation in Figure 1 gives a summary of related data, but does not reflect local differences. (For example, that the Arctic is warming three to four times faster than the rest of the planet.)
| Location | Present temperature | Current rate of increase per decade | Since preindustrial times |
| Total planet | 15.1 °C (59.0 °F) | 0.15 °C (0.27 °F) | 1.1 °C (2.0 °F) |
| Ocean surface | Over 17 °C (62.6 °F) | 0.25 °C (0.5 °F) | Over 0.7 °C (1.26 °F) |
| Land surface | 10 °C (50 °F) | 0.1 °C (0.18 °F) | 1.5 °C (2.7 °F) |
Figure 1: These average temperature changes do not take into account local variations, such as the arctic where temperatures are increasing at three to four times the global average
Ocean temperature measurement
The average ocean surface temperature is greater than 17 °C (62.6 °F), depending on season, location, etc., and is rising very slowly. It's increased some 0.7 °C (1.26 °F) or more from pre-industrial times to now. Its rise started at about 0.1 °C (0.18 °F) per decade in the first half of the industrial age, and today it's nearing 0.25 °C (0.45 °F) per decade or 0.015 °C to 0.025 °C (0.021 °F to 0.045 °F) per year. Accurately measuring such minute temperature changes is extremely difficult.
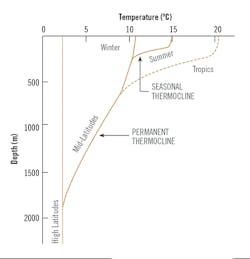
Water gets colder as the ocean's depth increases, but not linearly. At around 450 meters (1,500 feet) is the thermocline, and in this region the temperature drops faster (Figure 2). This layer separates the mixed and the unmixed regions of the ocean's water.
Our most accurate temperature measurement can be made with a four-wire resistance temperature detector (RTD) design using a platinum, Class AA sensor. Such RTDs can provide 0.01 °C accuracy. Note that, in some cases, vendor specifications give only resolution and the impression that resolution equals accuracy. This is incorrect and can be a sign of "specmanship." (An easy way to remember the difference between the two is to think of a clock, which has a resolution of one minute—the equal distances between the 60 markings—while its accuracy can be more or less.)

Figure 2: Further complicating the measurement of ocean temperatures, water gets colder and denser (heavier) with increasing ocean depth. (Source: https://readtiger.com)
In the past, one way to monitor average ocean surface temperatures was by taking samples or by attaching thermometers to buoys or ships. Radiosondes followed, and starting in the 1950s, satellites measuring microwave emissions were used. Other technologies, such as those leveraging GPS satellite signals have also been tried, but have limited recording length, and their accuracy hasn't been clearly established.
New designs: learning from fish
The basic operating principle of one of the most successful ocean temperature profiling measurement devices correlates density change to temperature. This method is used by fish to rise or sink while swimming in water. The density of an object is the ratio of its weight and its volume. If an object's density drops, it rises and vice versa. Fish change their volume-to-weight ratio, too. The volume of a fish is constant, so when its weight drops, so does its density. So, when its swim bladder is pressurized, its volume rises, and therefore the fish's buoyancy also rises (its density drops). Inversely, when the bladder is deflated, buoyancy drops and the fish sinks. This allows a fish to change its own density and sink or rise.
A new instrument design, the ORTO Float, uses the same flexible bladder method to rise and sink to measure the heat content and the temperature profile of the ocean at different elevations. At its tip, this float also varies its bladder volume, which is filled with an oil, the density of which is less than water. In the next installment of this column, I'll dig deeper into the description, operation and applications of this new sensor.

About the Author

Béla Lipták
Columnist and Control Consultant
Béla Lipták is an automation and safety consultant and editor of the Instrument and Automation Engineers’ Handbook (IAEH).
