Lubrizol uses cross-checking statistics process to find formerly hidden deviations

Just as eyesight and other optics must be focused enough to pick out useful objects, maps must be detailed enough to show points of reference in relation to each other. But, if important details, physical features or data and trends are too tiny or too low-resolution, they can be easily overlooked and missed.
For instance, Lubrizol Corp. reports it recently had an end-of-batch sample taken for final analysis, determined it was low in one of its metal ingredients, and set out to determine the cause using its regular manual cross-checking process, and later implemented statistics-based cross-checking.
“This situation was escalated to one the operations people, who looked through their batch sheets, which are handwritten notes about targets they’re supposed to be hitting and what they were seeing on their metering,” says Joanne Davies, data scientist at Lubrizol “They want to know if we get the recipe right, and everything had been checking out fine. So, when this metals issue occurred, they had to escalate to the engineer, who was digging for and looking at sheets from prior batches, which may or may not have been the product they made previously.”
Davies detailed Lubrizol’s batch experiences during her “Finding hidden deviations using a cross-checking statistic” presentation at Seeq’s Conneqt event in May in Austin, Texas. Located in Cleveland, Lubrizol manufactures active and stabilizing ingredients in 17 countries. Its products are reportedly in half of all vehicles worldwide, and are also used in coatings, clothes, medical devices and other items.
Manual is too little, too late
In the course of investigating the metal issue, Lubrizol’s operators and engineers discovered that the flowmeter for one of the of the batch’s ingredients had failed and undercharged the ingredient by about 15%. “The material then had to be worked off,” says Davies. “So, this issue wasn’t caught at the time the batch was charged.”
Davies reports that Lubrizol’s initial search for the cause of the metal issue employed its manual cross-check process, which takes time and typically doesn’t provide data or identify problems until a batch is finished. This end-of-batch inspection typically takes more than two hours, and includes checking batch sheets for the last five batches, examining instrumentation, and cross-checking level and source tank level data for the last five batches.
“The operators are thinking what ingredient may have contributed to the presence of the metal and whether the ingredients in the batch were charged accurately,” says Davies. “They also look at OSIsoft PI trends to figure out what was done for this batch and previous ones. I think everyone has had some experience looking through manual readings and records like this.”
Start with statistics
To alleviate the drawbacks of manual inspection, statistical cross-checking can show users variables that may be out of control by allowing them to investigate correlations for normal operations, determine if there’s a problem, and address it. Plus, it’s accomplished without requiring engineering time for cross-checking, and lets users know about deviations sooner.
“The operators can look at this online, cross-check statistics, and act when there’s a deviation on that control chart,” says Davies. “They own the issue at the time of the deviation. They become aware of it, correct it or escalate is as needed.”
Davies reports this statistical method begins by employing the classic Hotelling’s T-squared (T2) multivariate probability distribution, which is closely related to the F-distribution for continuous probability, and is a generalization of Student’s t-statistic that’s used in multivariate hypothesis testing.
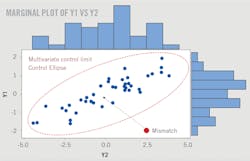
While the difference between Y1 and Y2 could be used, Hotelling’s T2 is more advantageous when dealing with three or more variables. “Hotelling’s T2 distills the data in a plot from an ellipse into a line,” says Davies. “Everything within the ellipse is in control, and everything outside is out of control.”
Streamline with software
While pursuing smaller deviations of about 15% in its batch performance, Davies found a Python software application called “hotelling” that can be imported to a notebook in the Seeq Data Lab application. “The challenge is we have manual cross checks that are happening after the batch has already been made. The solution is we can now use a single statistic to monitor those cross checks for the batch, and it indicates a very specific type of failure,” says Davies. “This means there’s less time spent doing the manual cross checks, and we don’t lose revenue from making off-spec products.”

Small but significant
The hotelling app and Seeq Data Lab can look at all the ingredients in a batch, whether it’s 10 or 30, and make sure each is charged accurately. “We take the cross-checks of all of them, such as data from drums, totalizers and weigh cells. They should all be correlated,” says Davies. “We may also be dealing with changing batch sizes due to recent raw material shortages, but now we can proceed with a 70% batch size instead of waiting.”
Davies and her team recently dealt with a batch in which the acid number had inexplicably shifted. She pulled some of its data, and found that the flowmeter handling a small amount catalyst had recently been calibrated, and was very slightly undercharging, which altered the acid number, even though this change was accurate and within acceptable tolerance levels. “Because this was a small change, it wasn’t an obvious thing to investigate,” adds Davies. “However, because it was a catalyst it was something that could influence the end of a batch.”
Davies reports that some ingredients are hard to add to batches because they’re waxy solids or oily substances that come from bags and must be measured and added manually using scoops. These difficulties were compounded by Lubrizol’s recently shifting batch sizes, but she adds that its new, built-in cross-checks make it easier to give feedback to the operators, and maintain accuracy despite changing batch sizes. In fact, its batch software also lets Lubrizol distill lengthy columns of cross-checks data into one statistic on one graph.
“All these cross-checks become part of a matrix. We look at how they’re correlated, and now the operators can look at one statistic over time,” says Davies. “They can also see any excursions, and that’s where they know to drills down into the raw data.”
Cross-checking continuous temperatures
Finally, Davies details how Lubrizol is using hotelling and Data Lab to handle continuous temperature changes in sequence throughout its batching process, and enable operators to quickly see failures or small deviations.
“What we’re interested in is when a temperature probe starts to deviate and isn’t in line with the other temperatures and is starting to crawl up and drift,” explains Davies. “If we’re using that temperature for downstream processes and it’s getting too hot, that means we’re going to start cooling, or it might be that we slow our rate. However, if we do that without knowing that it’s a real temperature increase, then we’ll be artificially tracing our cycle times, or possibly creating a product integrity issue or even a safety issue.”
Davies adds that Lubrizol could measure the differences between each of the six temperatures related to its probe, as well as their relationships to each other, but this would be time-consuming and labor-intensive. “This is another reason why using Hotelling’s T2 is more advantageous, and why looking at it as a statistic is more efficient than measuring differences,” says Davies. “You want to take the numbers into one statistic and make it easy.”
Davies concludes that using a software-based statistic for cross-checking lets Lubrizol’s batch processes leverage a correlation structure to monitor one statistic to quickly identify smaller deviations, save time compared to its manual cross-checking at the end of batches, and prevent off-quality or unsafe conditions.
“One limitation is that plots in the hotelling app are limited to 1,000 points,” says Davies. “So, if you’re doing a plot with a static start date, then you’ll eventually end up past that 1,000 points and the plot won’t update. Consequently, you would probably want to feed a rolling window of 1,000 points into the plot. In addition, we can’t program Hotelling’s T2 statistic into Seeq Workbench as a formula because the statistic involves matrix math that can’t be done in the formula.
“One next step would be to create an add-on script, add it to the schedule, and push the chart into a Seeq Organizer Topic or something visible to the user. It would also be useful to add some bivariate slots, and put them in the Organizer Topic, so when a deviation occurs, we can look back at the raw data. The statistic only tells you that one or more variables isn’t aligned, but you don’t know which one, and that’s the investigation part. The software simplifies, but it doesn’t solve the whole problem, so we have to go back and do the bivariate plots. It would be good to push that back into the organizer or something, and do the investigation there."