Key Highlights
- Recent advancements have made data analytics tools more accessible, reducing the need for specialized expertise.
- Machine learning integration enhances causal analytics, enabling more precise correlations and process optimizations.
- Continuous evaluation and updates of analytics models are essential to maintain accuracy and trust in results.
It might seem like having huge amounts of data and powerful software for analyzing it would be a blessing. For many decades, the problem was always gathering enough data, and coming up with effective ways to make sense of it and improve decisions. However, for individuals facing mountains of information, and many possible tools to approach and examine them, their new problem becomes deciding which data to analyze and what solution will be the most effective.
“The biggest evolution in data analytics is the accessibility of tools, especially during the last two or three years. Information has been available from everywhere for a while, but during the past 20 years, even chemical and process control engineers would likely need a PhD in data science to interpret it, so many analytics projects never got off the ground,” says Bob Rice, engineering VP at Control Station. “Now, there’s a ton of software tools that can do it, so it’s easier to get buy-in and find the expertise needed to complete them. Today’s analytics tools include open-source, Python-based code models that are super easy to use and very powerful.”
For instance, Rice reports that Control Station’s summer intern finished an analytics project two weeks early, which included building a learning tool for known data. It performs causal, machine-learning (ML) processes, and uses predictive AI models fueled by multiple sensor inputs to determine the most suitable action for completing different tasks.
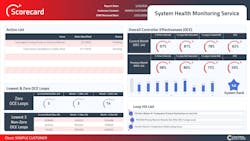
“Previously, it could take four years to put together a solution like this,” explains Rice. “Our intern used one customer’s PID performance data for six months on 130 loops, applied key performance indicators (KPI), and determined that 50 PID controllers were negatively impacting equipment performance. It took two weeks to complete a cursory report with some useful answers.”
Get your subscription to Control's tri-weekly newsletter.
Start small to seek reasons why
Rice explains that data analytics generally pursues two paths: predictive and causal. Predictive analytics looks forward, focusing on models to predict future performance, and use soft sensors to help fuel calculations. The other avenue is causal analytics that looks backward, seeks the reasons why events occurred, and concentrates on understanding problems that have happened. It relies on tracking KPIs that can show, for example, which valve needs attention among the hundreds or thousands in a unit or facility.
“Looking back in time to identify events and variables that caused failures is similar to troubleshooting, seeking anomalies, or conducting a root-cause analysis,” adds Rice. “Much of data analytics is also typically continuous because situations can happen all the time. However, causal analytics examines particular periods, seeing all the items and variables involved such as routine loops, so it will notice when new loops or other changes impact that environment.”
To make its causal analytics more efficient and effective, Rice reports that Control Station is looking at adding ML functions to its PlantESP software, and consulting with clients to build more correlations between performance areas, better understand the value of their controllers’ functions, and achieve greater optimization. These performance areas can include evaporation efficiency, paper-machine performance, production rates, steam per ton and other parameters. These processes can be tracked using higher-resolution KPIs, rather than continuing to rely solely on traditional statistics.
Rice adds the best way to deploy casual analytics, such as PlantESP, is to start small and in a specific area by selecting a device with a few inputs. This process may involve just 10 to 30 sensors and their PID controller, and monitor just a few variables, such as production rate or energy use, which can help solve a particular problem or achieve some other well-defined impact.
“The outcome of any analytics program should produce some kind of specific action, such as tuning a controller, fixing a valve, scheduling maintenance, or further inspecting equipment,” adds Rice. “PlantESP enables this by pulling data from historians, which lets users treat analytics like any other asset. Each may be different, but they also have models that need to be trained, and they need to be maintained and updated, or their performance and accuracy will degrade like any other component. Knowing when to upgrade analytics programs or other devices, depends on each individual application, but they all involve evaluating how they change, and determining if they’re producing results that users can have faith in.”
This is part seven of Control's September 2025 data analytics cover story. Read the other installments here.