Methods for improving process performance and assessing productivity
This Control Talk column appeared in the September 2020 print edition of Control. To read more Control Talk columns click here or read the Control Talk blog here.
Greg: In this Control Talk we are fortunate to have Héctor Henry Torres, principal control systems engineer for Eastman Chemical Company, discuss methods for improving process performance and to assess productivity to identify improvement opportunities using statistical tools. Additionally, control techniques are suggested for improving process performance. This is the first part of a two-part series. This material and much more originated from the chapter on Improving Process Performance in Process/Industrial Instruments and Controls Handbook Sixth Edition (McGraw-Hill, 2019).
Héctor, what are be some methods for measuring productivity?
Héctor: There are different methods used to measure productivity. The most common are: % gross yield (%GY), % utilized capacity (%UC) and % right first time (%RFT).
%GY indicates how efficiently the raw materials are being transformed into salable goods. An increase in %GY leads to a decrease in the manufacturing or unit costs and represents an immediate increase in capacity solely due to improved process efficiency. An increase in gross yield usually denotes a better utilization of energy and raw materials. From an environmental perspective, a more efficient and robust process reduces waste and makes the product more sustainable. Gross yield is calculated by dividing the pounds or kilograms of material produced within specifications by the total pounds or kilograms of all raw materials used; this ratio is then multiplied by 100:

%UC indicates the proportion of available equipment on-stream time being used to create on-spec product. Together with the nominal production rate, the %UC helps to describe the manufacturing capability. The available equipment time in a month or in a year multiplied by the nominal rate helps determine the available plant capacity. It aids in establishing the latent production gain associated with an increase in %UC. To calculate the percent of utilized capacity, divide the time the process is producing to specification by the total time available in the given period; the resulting ratio is then multiplied by 100:

%RFT represents the classic view of productivity; however, it does not reflect the true process yield. For example, consider a polymer film manufacturer selling rolls of film. Say the manufacturer has orders that justify winding just half of the total film width as a saleable product. The other half is wound for future recycling. If one hundred percent of the rolls are within specifications, the %RFT will be 100%; however, the %GY will only be 50%. The %RFT produces overly optimistic numbers as it only measures the proportion of on-spec product of the total units produced. It is calculated by dividing the units produced within specification by the total units produced, and then multiplying this result by 100:

Greg: What is the first step in improving productivity?
Héctor: First, focus on getting early benefits by identifying and implementing quick-win ideas. A quick win is a noticeable improvement that can be delivered shortly after the improvement project begins and has an immediate and tangible benefit. The best quick wins are inexpensive, easy to implement and provide the team momentum by driving early hits.
Conduct brain-storming sessions with operators, supervisors and engineering staff to come up with a list of quick-win ideas to implement. Explain first what a quick-win is and, before starting the process, emphasize that not all the ideas might qualify as true quick-wins; however, all the ideas exposed will be part of the list. A committee is then formed to evaluate all the ideas.
When screening the ideas, use questions such as: Would the implementation of this idea lead to a noticeable improvement in gross yield? And, could this idea be implemented within a relative short time? If it could lead to a noticeable improvement in yields but it cannot be implemented in a short time, then the idea qualifies as a long-term project. While quick wins lead to immediate results, strategic projects offer sustained and long-term solutions. Make sure you inform all the participants the results of the assessment and the implementation plan forward. Measure and document the benefits driven by the quick wins.
Manufacturing practices rank as one of the main categories leading to productivity losses. Most quick-win ideas lead to improvements in such practices. Quick wins require either procedural changes or the provision of additional tools for monitoring. Some procedural changes can be leveraged by means of the control system, where programming of process conditions and associated process actions ensure a procedure is executed during certain circumstances. Additional tools for monitoring could be as basic as designing conditional alarms or improved control system graphics that provide the operators with better situational awareness.
Standardize new practices by updating your standard operating procedures and standard operating conditions (SOPs and SOCs, respectively), failure mode and effects analysis (FMEA), control plan, as well as control system basic process actions. And, don’t forget to provide proper training.
Greg: How can we assess process performance?
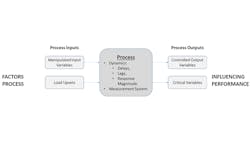
Héctor: Identify the process conditions that cause the quality characteristics to deviate from specifications (Figure 1).
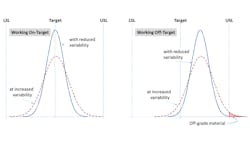
Figure 2: When the process is working on target, the dispersion or variability could be tolerated if it allows the process to be working within required operating conditions and, in the case of product’s quality characteristics, if the variation is small enough to stay within specifications and at the customer’s required capability index. Notice that when the process is working off-target, an increased variability could take the process beyond the lower specification limit (LSL) and the upper specification limit (USL). In the case of a manufacturing process, this could translate into violation of given constraints, higher utility consumption, or could drive processes downstream towards instability. When referring to product specification limits, an excessive variability when working close to limits could result in higher off-grade material rates.
Manipulated input variables to the process are those manipulated parameters that are set to:
-
Control at a specific value or given range for a controlled process output. The controlled output could be a process parameter or a product’s final quality characteristic.
-
Keep critical process variables within a certain range. In the aim of controlling a parameter, it could be possible that other process conditions or quality characteristics are negatively affected. These become constraints to the process, and they define the operating limits of the process and even of the equipment. It is important to identify, list and monitor these critical variables.
Load upsets are present in all processes. They are disturbances in the process that could originate from upstream processes, rate changes, changes in feed or ambient conditions and raw materials. In turn, the process is subject to its own nature when processing the inputs that could be both measured and unmeasured. The process has an embedded dynamic response that is subject to delays (process deadtime) and lags (time constant). The process also responds with a certain magnitude reaction to a given change in the input (process gain). The observed responses of the process—controlled and critical variables—are also subject to the measurement system in place.
Assessing the process is accomplished by charting process location and variability. Location and dispersion are better understood when the data is plotted using histograms (Figure 2).
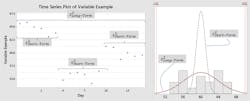
Figure 3: When the data being analyzed includes observations made at different levels of the process inputs, the data is said to be long-term data. The total variation of the process includes both short-term and long-term variations.
Process output variability consists of controlled and uncontrolled variations. The controlled variations follow a consistent and stable pattern of variability over time. This variability is associated with “common causes” and is considered short-term. The uncontrolled variations are characterized by changes in variability led by sudden and momentary changes in the process output or by a shift in the level of operation that are identified as “special causes” and are encountered in long-term data.
Determining the opportunity for improvement is normally done by comparing the short-term and the long-term process variability. Short-term variability is observed when the process inputs are kept constant. That is, the short-term variability does not include changes in the manipulated variables, different operators, formulation changes, etc. The variability observed in the controlled output variable is merely an indication of the inherent process variability. In some cases, this variability is induced by poor sensor selection and location.
Additional variability is observed when the process inputs are changed, affecting the output. The induced variability could be so large that it results in a process output violating the specification limits. When the data being analyzed includes observations made at different levels of the process inputs, the data is said to be long-term data. The total variation of the process includes both short-term and long-term variations.
s2Total = s2Short-Term + s2Long-Term
The long-term variation can come from different sources: equipment, day to day process changes, operators, raw material lots, seasonal variations, etc. The objective is to determine sources creating this variation and reduce their impact on the process.
Both short- and long-term variations are normalized to allow comparison of different processes and establish the process capability. The short-term variation represents the best the process can perform and is considered the process entitlement. The long-term variation represents what the customer is observing. It is a picture of the actual performance of the process. The normalized versions of the variability in a process are known as capability indexes:
-
Potential process capability: Cp. Best possible achievable capability if the process were centered in the specification range. It considers the tolerance range divided by the short-term process spread.
-
Short-term process performance: Cpk. Current index based on the actual location of the process.
-
Long-term process capability: Pp. Actual long-term capability if the process were centered in the specification range. It considers the tolerance range divided by the process spread in the long-term.
-
Long-term process performance: Ppk. Current index based on the long-term location of the process.
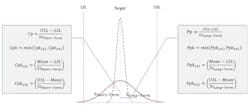
Figure 4: These formulas can be used to calculate process capability (Cp), short-term process performance (Cpk), long-term process capability (Pp) and long-term process performance (Ppk).
They are calculated in the same way; the difference is the standard deviation (s) used (Figure 4). The Cp and the Pp assume the mean of the controlled variable is on target or, in other words, centered in the range. The Cpk and the Ppk are the actual performance based on the current location of the process.
Greg: Stay tuned for Part 2 on how to improve process performance, special causes of variability, and best practices.

(10) Increase the frequency of dish washing
(9) Consider “the look” a reliable feedforward signal
(8) Preemptively take the garbage out
(7) Disturbances could originate from upstream processes, consider reducing in-laws’ visits
(6) Realize additional variability occurs when kids are out of control
(5) Long-term variability is inversely proportional to the tolerance range
(4) Learn to intently listen to spouse with greatest sensitivity
(3) Read Control Talk together and talk about how to use process control in marriage
(2) Apply corrections with least stiction and backlash
(1) Marry an automation professional

About the Author

Greg McMillan
Columnist
Greg McMillan retired as a senior fellow at Solutia Inc., now a subsidiary of Eastman Chemical, in 2002. He was an adjunct professor in Washington University Saint Louis’ Chemical Engineering Department 2002-04, and retired as a principal senior software developer at Emerson Automation Solutions in 2024.
