Data integrity series: controller output issues
Key Highlights
- Control valves and positioners create data integrity problems indirectly—by introducing real process variability that propagates through measurements
- The positioner is a control loop within a control loop; all cascade timing rules apply
- Lost motion and resolution create limit cycles that appear as process disturbances in data
- Instrument air quality is a foundational but frequently neglected source of valve performance problems
- Oscillations from one problematic valve can propagate throughout interconnected processes, corrupting data far from the source
- Valve testing and diagnostics provide actual performance data rather than assumptions—critical for interpreting process data correctly

Greg: This is the fourth in a series of discussions with Mike Glass, owner of Orion Technical Solutions, about ensuring data integrity for process control and industrial automation systems.
In our previous discussions, we covered how filtering shapes signals, how digital systems can degrade data quality, and how the best filtering and digital architecture can't save you if the original measurement is wrong. Let's talk about the many issues with final control elements.
Mike: Thanks, Greg. This topic doesn't get nearly enough attention when people discuss data integrity. Most engineers focus heavily on measurement and obsess over transmitter accuracy specifications, worry about sensor drift, and invest time and resources into testing the calibrations of transmitters that really don't drift much. They often treat output as a perfect actuator that instantly and precisely executes whatever the controller commands.
The reality is quite different, and here's the critical insight that many people miss: output device problems corrupt data indirectly by creating real process variability that shows up in measurements. This isn't measurement noise you can filter out. These are actual process fluctuations caused by mechanical issues in final control elements.
Greg: Can you walk through how that happens in practice?
Mike: Absolutely. Consider a scenario I encounter regularly. An operator notices a small packing leak on a control valve and tightens the packing to stop it. Seems reasonable, right? But they overtighten it, dramatically increasing friction on the valve stem.
Now you have stiction—static friction that the actuator must overcome before the valve moves. The valve only responds when actuator pressure builds enough to overcome those frictional forces, resulting in jerky, stick-slip movement, rather than smooth positioning.
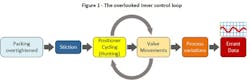
Here's where the data integrity problem emerges. The positioner is essentially running its own PID control loop to maintain valve position at the commanded setpoint. With high stiction, it struggles to position accurately. Even if the process itself were inherently stable, the positioner's constant hunting creates real variations in flow, pressure or whatever the valve controls.
Greg: So those variations propagate through the process and corrupt the measurement data.
Mike: Exactly. If you're trending level or flow or temperature downstream, you'll see fluctuations that look like process disturbances or measurement noise. But they're neither. They're mechanical artifacts from your control valve that have become embedded in the actual process. You can’t filter them out because they’re the real representation of the process.
Oscillations propagate, often far from the source
Greg: This propagation effect can extend quite far through a process, can't it?
Mike: It absolutely can, and this is one of the most insidious aspects of final element problems. When valve issues create oscillations, they don't remain isolated to that valve's immediate loop, they propagate throughout interconnected processes, creating data corruption far from the source.
Small oscillations in valve position can be amplified by process dynamics, particularly in systems with high gain or resonant characteristics. A barely perceptible 0.5% valve oscillation in a reactor feed valve can create significant temperature oscillations if it excites the reactor's natural frequency, or if it operates at a point where the fluctuations are amplified by the overall gain of the process.
Greg: These oscillations can cross into seemingly unrelated variables.
Mike: Exactly. It’s what I call cross-variable contamination (i.e., loop interactions). Valve oscillations in one process stream contaminate data in seemingly unrelated measurements. Minor hunting in a cooling water valve can create oscillations that appear in product temperature measurements downstream. Analysts may spend considerable time looking for a process cause when the issue is purely mechanical.
The propagated oscillations often blend with normal process variability, making them difficult to distinguish from legitimate process dynamics. Frequency analysis may be necessary to separate these mechanical signatures from actual process behavior.
Greg: Time delays make this even more confusing.
Mike: They do. Due to process deadtime, the oscillations may appear in different measurements with varying time delays, creating the false impression of complex, time-dependent process interactions. The true impact of a cycling valve extends far beyond its immediate loop—and engineers analyzing the data downstream may have no idea the root cause is a valve problem several units upstream.
The timing (and magnitude) of the fluctuations can change based on things like changes in packing, booster adjustments, instrument air settings and issues, positioner settings and more.
The positioner: a control loop within the control loop
One of the most overlooked aspects of control valve behavior is that the positioner is itself a control loop. It has a setpoint (the command signal from your controller), a process variable (valve position feedback), and a controller algorithm driving the error to zero.
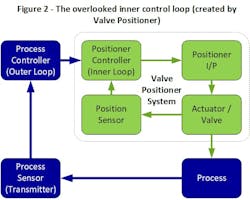
Greg: Unfortunately, many engineers don't think about it that way. They treat positioner, actuator and valve as a single block in their control loop analysis.
Mike: That creates problems because all cascade control rules apply. The inner loop—positioner controlling valve position—must be significantly faster than the outer loop. Classic cascade theory says three to five times faster. This can easily become a problem with faster control loops and/or slower valves.
Also, all the errors of the control valve and positioner system become part of the overall process response. So, ignoring those valves, positioners, actuators etc. is incredibly detrimental to overall control—and causes variability that results in low-integrity data.
When that relationship breaks down, valve dynamics limit your overall control performance rather than process dynamics. I've seen this cause significant problems with faster loops like flow and pressure control.
You might have a process responding in two seconds, but if your valve takes four seconds to reach position, you're no longer controlling the process—you're being controlled by the valve.
Its data signature is characteristic of "sluggish then overshoot" patterns. You command a change, the valve responds slowly, the controller keeps pushing because it doesn't see adequate response, then suddenly the valve catches up and overshoots. Someone analyzing this data might conclude the process has strange dynamics, when it's simply valve response limiting performance.
Greg: This matters significantly for process simulations as well.
Mike: That's an excellent point. If a simulation doesn't include behaviors that happen after the controller—the real-world deadtimes, lags, gains, stroke speeds, resolution and lost motion—then the simulation won't be accurate.
Many models treat valves as ideal entities with at best a valve characteristic curve and a flow coefficient (Cv) number with no delay and no control function. Of course, those simulations won't respond like real processes, especially on faster loops with larger valves. While we won't go deep into simulations here, any process simulation used for serious engineering work, not just operator training, should recognize the complex behavior downstream of the controller—and factor it in. If not, the applicable engineer needs to factor it into their conclusions.
The worst-case scenario is where a plant uses a model that doesn't account for output device realities, and fails to address the problems that exist in those devices. The errors are in the real world, but not in the simulation.
Resolution and lost motion: the silent data corruptors
Greg: Let's discuss resolution and lost motion in valves, and how they affect performance and data integrity.
Mike: Resolution is the gap between when a command signal changes and when the valve moves. If I'm at 50% position and command 50.5%, the valve might not move until the command reaches 51% or higher. That creates a dead zone, where the process drifts uncontrolled. The resolution for many installed valves is much higher than most users would assume.
Greg: Even small amounts of resolution create significant limit cycles. Of course, those cycles are rarely rhythmic. They tend to be very erratic. Occasionally, the valve position randomly lands closer to target, and it takes longer for the next adjustment cycle, but that'll likely be a bigger adjustment cycle, and so on.
Mike: So, a valve with 2% resolution on a high-gain process can create limit cycles several times larger than expected. Here's the data integrity problem: those limit cycles look like process oscillations. Someone analyzing the data might conclude you have a tuning problem, input noise or process interaction, when you actually have a mechanical problem with the final control element.
Lost motion is related but different. It's the difference in valve position between increasing and decreasing signals at the same command value. Command 50% while increasing, and the valve might be at 49.5%. Command 50% while decreasing, and it might be at 50.5%.
Greg: So, your process follows two different control curves depending on direction.
Mike: Exactly. This creates data inconsistencies that confuse analytics algorithms. A predictive model trained on increasing output data might perform poorly when that output decreases. The correlation between valve position and process response appears inconsistent, but it's perfectly consistent with lost motion behavior, just not what the model expects.
Greg: What creates these problems?
Mike: Several factors cause resolution and lost motion. Mechanical friction—stiction between valve stem and packing—is the most common source.
Greg: Packing is necessary to prevent process leaks, but every packing design creates friction the actuator must overcome.
Mike: Lost motion in mechanical linkages is another major contributor. Even valves with direct stem connections have play in the joints. Rotary valves tend to have more lost motion because additional linkage converts linear actuator motion to rotary valve motion. I've seen rotary valves with dramatic lost motion just from mechanical connections, and in the control system in question, it was a major obstacle.
And lost motion gets worse over time. Wear on stems, bushings and guides increases clearances. A valve performing well when new might develop significant resolution after years of service without anyone noticing because its degradation is gradual.
One of the most valuable analytical tools available is actual valve position data, especially if sampled and stored at a reasonable sample rate. It's baffling to see multibillion-dollar facilities that skimp on running position signals back to the controller to save a few dollars. A valve position plot compared to command signal is incredibly powerful for diagnostics.
False process dynamics: when valve problems mimic process behavior
One of the most insidious ways mechanical output problems corrupt data is by creating patterns that mimic legitimate process behaviors.
Greg: Which would lead to misdiagnosis.
Mike: Indeed. Stiction creates characteristic limit cycles, but what you see in the data depends on how fast the process responds relative to the valve. In fast loops—flow, pressure—the process tracks the valve's stick-slip behavior closely. The PV oscillates in a square-like wave as the valve sticks, then suddenly breaks free and overshoots. The controller output meanwhile ramps in a saw-tooth pattern as integral action builds up and then down each time the valve is stuck.
In slower loops—temperature, composition, some level applications—the process dynamics smooth out the valve's jerky movements. The PV shows a more rounded, sinusoidal oscillation that can easily be mistaken for a tuning problem or upstream disturbance. This is the more insidious case because the mechanical root cause is disguised by the process response. Data scientists may also spend considerable time looking for a process cause when the issue is, again, purely mechanical.
Sluggish valve response due to oversized actuators or positioner issues can make the process appear to have longer time constants than it does. This leads to models that overestimate process inertia and underestimate potential control performance.
Greg: Lost motion creates a different but equally misleading pattern.
Mike: Right. Lost motion—primarily from lost motion in linkages—means the valve tracks fine in one direction, but when the controller reverses, the valve doesn't respond until the signal traverses the dead zone. The problem isn't directional. It's about reversals.
Consider a level control loop in an integrating process. During a long fill or drain cycle, the controller output moves steadily in one direction, the valve tracks fine, and level trends smoothly. Everything looks good. But as level approaches setpoint and the controller needs to reverse direction to settle, the lost motion hits. The controller reverses, but the valve keeps going until the signal traverses the dead zone. Level overshoots. The controller pushes back, traverses the lost motion again, and level overshoots the other way. In the trend data, you can see a smooth approach followed by hunting around setpoint that no amount of tuning eliminates.
Greg: Self-regulating processes show a different signature.
Mike: They do. On a flow or temperature loop, the controller is constantly making small corrections, frequently reversing direction. Each reversal hits the lost motion. The result is continuous wandering—the PV oscillates within a band proportional to the lost motion times the process gain. It looks like sloppy control or a noisy process. Tightening the tuning makes it worse because more aggressive control means more frequent reversals, each one hitting that dead zone.
The practical consequence is that engineers see this behavior and blame tuning, or model it as process nonlinearity. I've seen plants implement gain scheduling to compensate for what turned out to be lost motion in a rotary valve linkage. Fix the mechanical problem, and suddenly the "complex process dynamics" disappear.
Actuator sizing: thrust margin matters
Greg: What other issues can lead to variability and bad data related to valves?
Mike: Another important issue to manage is valve stiffness or thrust margins. The difference between the actuator's available force and the total force required to operate the valve. I call it actuator stiffness (though that isn't universal terminology).
Greg: Explain how it’s determined.
Mike: You must account for unbalance force from process pressure acting on the plug, the seat load required for your shutoff class, packing friction, and dynamic forces from the flowing fluid. Add those up, and your actuator needs to deliver significantly more than a total margin of at least 25-50% under worst-case conditions, and often more for demanding applications.
When that margin is inadequate, you get an asymmetrical response. Consider a valve with marginal actuator thrust closing against high differential pressure. Process forces fight the actuator; the valve closes sluggishly or may stall altogether. When opening, those same process forces assist the actuator, and the valve moves quickly.
I saw a very large and expensive water-injection project that exhibited this problem to an extreme level. It was a poor design that simply failed to calculate the forces on the valve and actuator, which proper engineering should have caught. It caused great variation in responses based on varying system pressures and direction of actuator movement.
Greg: So, the valve behaves differently depending on direction and process conditions.
Mike: Exactly. In the data, this appears as process nonlinearity. The relationship between controller output and process variable seems to depend on operating conditions—valve position, differential pressure and flow rate. Analytics algorithms might model this as process characteristic variation when it's really actuator limitation.
The other problem is what happens as the valve ages. Packing friction increases, springs weaken, and seals wear. The safety margin you had at commissioning erodes over time. A valve that performed well initially develops asymmetric response, or starts having trouble seating properly.
I sat through a class on valve diagnostic testing a couple of years ago, and I was genuinely impressed by how many of these issues and problems can be easily identified by diagnostic testing systems. Even new valves often have problems. Creating the resources (time and equipment) to deep dive into problems like those we’re talking about seems like a wise investment for a plant.
Greg: This is why adequate thrust margin at initial sizing pays dividends over the valve's service life.
Mike: The cost difference between a marginally-sized actuator and one with adequate reserve is minimal compared to the control problems and maintenance headaches an undersized actuator creates. Grossly oversized actuators have their own issues—excessive seat loading that damages trim, and larger air volumes that can slow response. The goal is appropriate margin, not maximum size.
Instrument air: the overlooked foundation
Greg: What are other areas that most sites miss when it comes to control valve operation?
Mike: A huge one is an air supply instrument. Air quality causes control valve problems affecting data quality.
The positioner contains very small orifices in its I/P transducer, which is the component converting electrical command signals to pneumatic pressure. Any contamination migrates to these orifices and partially or completely blocks them. These problems also produce nonlinearities, and erratic and inconsistent behaviors.
If you aren't treating instrument air as critically as safety systems, you're missing the big picture. Instrument air feeds nearly every control valve and every safety valve, among others. Air supply problems cause problems across dozens or hundreds of loops.
I've seen plants where air dryers weren’t serviced in years, with air filters so clogged they'd clearly never been replaced, and water separators full of rusty brown water. I’ve even seen evidence of rusty water running down from positioner exhaust ports. The system air is wet, with rust forming inside tubing, and people wonder why valves act erratically. Simple preventive maintenance would eliminate an entire category of data integrity problems.
Interestingly, years ago, I taught an instrumentation class at a large powerplant in the eastern U.S., and started talking about problems with IP transducers. Everyone looked dumbfounded, as if they’d never seen an IP problem, even though they were using the exact same brands that I’d seen lots of problems with at many sites. This was because the engineers at this plant treated the air system like it was a top-priority safety system. They maintained it intentionally, and I'd even say strategically. All their technicians knew the rules on working with their air systems. I have to say I was impressed. Those little details make a huge difference. Their IPs ran fantastically. Take care of the little details and the big things seem to fall into place.
Greg: The solutions are straightforward—proper filtration, dryers and moisture separators.
Mike: Agreed, and the last one I'd add to that list is proper maintenance of those systems. Improving instrument air systems and taking the associated maintenance seriously is low-hanging fruit for plant improvements.
Once those air systems are neglected for a long time, the fix can be really painful and expensive because there’s often moisture, rust and debris throughout the system. But replacing the local filters and maintaining them is at least a positive step forward for the poor engineers and maintenance/reliability managers, who walk into those situations, and need to make headway, but can’t revamp the whole instrument air supply.
Volume boosters: hidden complexity
Greg: You mentioned air boosters. Explain what they are and the issues they can cause.
Mike: On larger actuators requiring fast response, volume boosters are installed between positioner and actuator to increase air flow rates for faster stroking. But those boosters add complexity that's frequently misunderstood.
The booster has an adjustable bypass restriction that must be set up before initializing or calibrating the positioner. The procedure for adjusting one type of very commonly used booster (per manufacturer instructions) recommends starting with the bypass partially open, and then slowly closing it while the actuator is operating until large signal changes trigger the booster. Meanwhile, small changes pass through the bypass without activating it.
Get your subscription to Control's tri-weekly newsletter.
Greg: What about sizing the boosters?
Mike: Proper sizing matters—but just like in control valves, bigger is not better. Engineers should select the lowest-capacity booster that meets their stroking speed requirements. An oversized booster may require the bypass to be opened so far that it never actually operates, defeating its purpose.
Greg: How can valve actuator boosters cause data problems?
Mike: What makes boosters insidious from a data integrity standpoint is that problems—contamination, worn diaphragms, a maladjusted or clogged bypass—create erratic valve behavior. If debris clogs the bypass, the booster triggers on small signal changes, causing hunting. If the booster itself is sluggish from contamination, you lose the fast response you need. Either way, erratic positioning creates real process variability.
Someone troubleshooting the loop might blame tuning, the positioner, or even the process itself, never suspecting that maintenance tweaked the booster bypass, or that debris from contaminated instrument air has accumulated in the booster internals.
Valve sizing problems
Greg: What about valve design and sizing?
Mike: Improper sizing creates multiple data integrity issues. Oversized valves operate in the difficult-to-control bottom portion of their range, creating excessive sensitivity to small signal changes. Undersized valves obviously may not achieve higher demand loads.
Greg: Explain how an oversized or undersized valve might cause data integrity problems.
Mike: A significantly oversized valve might operate between 10% and 20% during normal conditions—a tiny slice of its total range. With so little usable travel, the valve is working in the region where friction is highest, and valve gain amplifies any stick-slip effects. You also have very few increments of adjustability across that narrow operating window. Precise control becomes difficult.
Undersized valves have the opposite problem—they max out before process demand is met, potentially failing to reach setpoint even with the controller output at 100%.
Either condition degrades control performance or can lead to reset windup. Critical for data integrity: the limitations are mechanical, not process-related, but they'll show up in your trends looking like process problems or bad tuning.
Greg: This sure makes a case for having high-resolution control valve position data at a high enough sample rate to see what’s happening inside the valve.
Mike: Absolutely. As I mentioned earlier, actual valve position is one of the most important parameters to monitor when troubleshooting control performance. Basic analysis—comparing commanded versus actual position, tracking response times, and watching for developing patterns—could very easily catch many of the problems we've discussed. The data is usually already there in the system. All that's needed is a relatively simple background routine in the PLC or DCS to flag issues, and alert maintenance without impacting normal control. It's not exotic technology, it's just underutilized. With all the work aimed at advancing intelligence in the process control world, I’m amazed that more plants aren't implementing solutions like this. It can easily be done with existing (even 1980s) technology and some basic code.
Process-induced valve problems
Greg: How does the process itself create valve problems that affect data?
Mike: Cavitation and flashing are prime examples. When liquid pressure drops below the vapor pressure at the vena contracta inside a valve, vapor bubbles form. If the downstream pressure recovers above the vapor pressure, those bubbles violently collapse—that's cavitation. If the pressure stays below vapor pressure and the liquid remains vaporized, that's flashing.
The data signature of cavitation is most dramatic with DP-based flow measurement—orifice plates, venturis, flow nozzles. Instead of a relatively smooth signal, you get significant noise in the signal. These rapid fluctuations create constantly changing error values that the controller chases, creating secondary oscillations that compound the problem. Noise at the sensor is always bad—per our article on filtering and noise earlier in this series.
Another issue that can cause confusion in process analysis is choking conditions. Choking is when flow velocity reaches sonic levels in gas service, or when vaporization limits liquid flow—creating nonlinear capped response patterns. Flow data shows characteristic flattening at specific values regardless of how much the controller opens the valve, even before the valve is fully open.
Greg: Please explain to our readers, how do you detect cavitation or flashing in the field?
Mike: Often the simplest way is to walk out and listen. Cavitation produces a distinctive crackling noise, like gravel flowing through pipe. Flashing sounds different—more of a hissing, like sand. If you hear gravel, that's your red flag. Both are bad, but cavitation is the culprit for causing data problems due to the violent pressure fluctuations it produces downstream of the valve.
Value of valve testing and diagnostics
Greg: Everything we've discussed makes a strong case for testing and validating control valve performance, rather than assuming it's adequate.
Mike: Many plants never test control valve response. They install them based on sizing calculations that are sometimes based on assumptions and commission by verifying open and close, and then assume adequate performance. Even if the positioners are tested or calibrated, they’re often very minimalistic, unloaded tests.
There are some diagnostic valve testing tools that can characterize valve response in detail—stroking the valve while precisely measuring position versus time, quantifying resolution, identifying actuator sizing or bench set problems, and documenting performance degradation over time. They do something like the profile, full-stroke checks of some smart positioners, but to a greater degree of accuracy, and at the actual connection to the valve plug vs. at the actuator. This helps identify those lost-motion and resolution issues among other things. They can also check seat compression, and intelligently determine problems, inclusing damaged springs, gouged stems, improper spring/bench sets, and many other issues. Due to sensitivity of the sensors, these systems can even detect cavitation and other problems. This testing should be part of the R&M program for critical (and problematic) control valves at any serious plant.
Greg: I’ve personally witnessed a very serious decline in the performance of control valves, which can be largely traced back to the lack of any response requirement on valve specifications, and the desire to minimize cost and maximize flow and tight shutoff, which leads to on-off valves posing as throttling valves. Smart positioners can’t fix dumb valves because the valve needs to have a different body and actuator designed for throttling. Consequently, they’re often lied to by feedback from positioner links not realizing what’s going on with the actual stem and internal-closure element.
I addressed the problems and solutions in ANSI/ISA-TR75.25.02-2024, "Annex A - Valve response and control loop performance - Sources, consequences, fixes and specifications." In this annex, I give equations to predict limit cycles caused by stiction (officially termed resolution) and backlash (officially termed lost motion) in control systems with more than one and more than two integrators, respectively. The integrators can originate from integral action in positioners, controllers, and processes. I also detail the loss in rangeability due to resolution that’s typically worse near the closed position, oversizing of valve capacity, and severe deterioration of the installed flow characteristic from a decrease in valve-to-system pressure drop ratio in a misguided attempt to reduce energy use.
There are also a lot of mistakes made in variable frequency drive (VFD) inverter and controller design and implementation, which leads to poor response and incredibly bad resolution. Most notable is the severe loss in rangeability caused by high static head, and the lack of understanding of the need to go solely to torque control that omits speed control. The extensive results of studies by Peter Morgan, concluding with a list of good practices by me, are presented in the article, “Centrifugal pump control: implications of high-static head/system pressure in VFD applications”.
Mike: I reviewed some of your past articles on this recently, and through your Annex A material and supporting articles, several points hit home for the data integrity discussion.
The observation that digital positioners can generate misleading diagnostics because they measure actuator shaft position, rather than actual closure member movement, is a data-integrity problem hiding in plain sight. Lost motion, shaft windup and other mechanical realities mean the system may tell you everything is fine, while the ball or disc isn't moving. The findings about how dramatic that difference can be are eye-opening, and something every process and controls engineer should understand.
James Beall's finding that more than 30% of loop variability traces back to valve response deficiencies puts a number on something many of us have long suspected but couldn't quantify.
The absence of response requirements on valve specifications means we're essentially accepting "no requirement that a control valve actually moves in response to a signal." That's not a controls problem or a tuning problem. It's a procurement problem that manifests as bad data, and the lost motion from that oversight shows up in every trend chart for the life of the valve.
The work you've done to get these issues into ISA standards is exactly what the industry needs. Great work on adding so many critical insights and knowledge to the I&C realm. I'm looking forward to seeing wider adoption of the testing and specification practices you've outlined.
I'd add one more related issue that compounds the problem—and I'm admittedly biased here—but I believe many of these problems trace back to the decline in investment in training and developing our engineers and technicians. Technology has advanced dramatically, while our efforts to educate personnel haven’t kept pace. Too often, technicians and engineers are placed in positions and assumed capable simply because they're intelligent and have good aptitude. None of us know what we don't know. For that, we need real experience and input—the kind that comes from mentoring, structured training and development programs. My hope is that articles like this one can help open some eyes, bring fresh ideas to people, and help them learn what they didn't know they were missing.
Greg: Great conversation, Mike. I've enjoyed these discussions, and I believe they bring some of the fresh ideas you're hoping to convey to the industry.
Mike: Thanks, Greg. It’s been a pleasure. We're both teachers at heart—sharing knowledge and building on the knowledge base of this field is in our blood.
Top 10 lessons learned from valve response to improve spouse response
- Minimize lost motion in relationship
- Avoid sloppy conversations
- Improve resolutions in relationship
- Minimize friction in conversations
- Seek accurate feedback
- Minimize delay in responses
- Don’t minimize energy needed in conversation
- Avoid saying too much
- Don’t jump to conclusions
- Use external-reset-feedback to stop cycling back and forth about the same topic
About the Author

Greg McMillan
Columnist
Greg McMillan retired as a senior fellow at Solutia Inc., now a subsidiary of Eastman Chemical, in 2002. He was an adjunct professor in Washington University Saint Louis’ Chemical Engineering Department 2002-04, and retired as a principal senior software developer at Emerson Automation Solutions in 2024.

Leaders relevant to this article: