Digital twins key prosperous process control
Key Highlights
- Advances in instrumentation, modeling and control are more fully understood and utilized when assisted by first-principle, dynamic simulations with digital twins.
- Online metrics can be developed to demonstrate increased process capacity and efficiency, and justify greater commitment to process control improvements.
- Exploration, innovation, development, prototyping, deployment, training, maintainability, reliability and sustainability of basic and advanced process control, state-based control and procedure automation are greatly enhanced.
- A semi-autonomous, process-control future can be realized, with the roles of automation and maintenance professionals and operations elevated to investigating improvements.

The last 50 years of Greg McMillan’s career have been focused on finding and implementing improvements in process control with a focus on understanding the impact of process, measurement and final control element dynamics and PID algorithms and tuning. In every case, he used dynamic, first-principle simulations to gain the knowledge needed. It was particularly challenging for the first 20 years because he had to write simulations and PID algorithms using Fortran and Advanced Continuous Simulation Language (ACSL). The advent of Emerson’s Aspen HYSYS and Mimic software for process modeling enabled him to develop more comprehensive simulations.
The development of digital twins was a great step forward because many advances in PID algorithms could be employed, allowing users to focus on process and instrumentation dynamics, and implement PID capabilities. Greg’s modeling breakthroughs via Mimic objects enabled him to maximize the use of advances in batch and continuous PID control and tuning. His recent Control article “Route to the best process control destination” provides a concise summary of his career and key case histories.
Over the past 15 years, Edin Rakovic’s career followed a complementary path, rooted in simulation and digital twin technology, and shaped by direct, global engagement with customers on how these tools are adopted and used. Working closely with operators, engineers and plant leadership across power generation, chemicals, energy and manufacturing, Edin saw that digital twins’ value is rarely limited by model fidelity, but gauged by how effectively simulation, control systems, operator training, lifecycle data and business metrics are integrated into daily operations.
This customer-driven perspective reinforces a key insight: digital twins deliver their greatest value when treated not as standalone engineering tools, but as living operational assets, which are continuously used to reveal root causes, improve operator performance, validate control strategies and make automation benefits visible and measurable. Together, this foundational control expertise and real-world deployment experience frame how digital twins can bridge the gap between technical capability and sustained operational excellence.
The future belongs to plants that learn before operating
Digital twins will shape the future of industrial operations. Some think a definition is optional, but clarity guides every decision, and prevents misalignment across teams. The right definition shapes the right outcomes.
A digital twin should behave like a plant. It predicts behavior before it happens. It gives teams a safe environment to rehearse high-risk scenarios. It exposes vulnerabilities long before they reach operations. It turns insight into readiness.
Prediction is the new foundation of industrial confidence
Powerful digital twins follow a proven structure. Some believe simple models are enough, but complex plants need depth, and layering simplifies decisions. Complete twins outperform partial ones.
Strong digital twins are built with intention, structure and depth. Strong twins rely on layers that work together. Process behavior forms the foundation. Control logic keeps the plant safe. Instrumentation and scenarios drive operator readiness. Layering creates confidence. A complete digital twin integrates every operational layer.
Resilient organizations prepare for what others hope to avoid
Aligned teams create aligned operations. Some think misalignment is unavoidable, but clarity prevents confusion, and early rehearsal eliminates risk. The truth is misalignment is preventable when teams train together.
The highest cost in industrial projects isn’t equipment. It’s misalignment. Misaligned expectations, procedures or logic create rework, delays and preventable costs. Digital twins bring together teams before small issues become expensive ones. Alignment is built through shared understanding. Teams see issues earlier when they train together. Operators and engineers synchronize faster in simulated environments. Discrepancies are resolved long before operations go live. Alignment reduces rework. Digital twins prevent misalignment before it becomes costly.
Next-era of industries will simulate before running
Accuracy elevates engineering and training. Fidelity strengthens every decision. Real thermodynamics create real responses. Accurate instrumentation builds operator trust. Control logic behaves consistently across training and the field. Realism creates readiness. High-fidelity twins deliver high-quality decisions.
Every safe operation begins with a practiced response
Confidence grows through practice and repetition. Some think confidence comes from experience, but repetition builds clarity, and simulation strengthens performance. Operators learn fastest with safe rehearsals.
Operators build confidence not from time spent in roles, but from time in practice. Operators excel when they train on complex scenarios long before they face them in real operations. Digital twins turn uncertainty into confidence. Confidence is the result of repetition. Operators respond faster when they rehearse. Critical moments feel familiar after practicing with simulations. Teams coordinate better when they train together. Practice builds confidence. Simulation turns uncertainty into confidence.
Leaders who train teams build safer, stronger operations
Aligned teams accelerate every project milestone. Some think alignment is automatic, but shared environments create clarity, and early practice builds unity. Alignment grows when teams learn together.
Digital twins bring engineering, operations and leadership into one shared understanding. Alignment reduces cost, improves coordination and increases predictability. Multi-team training environments elevate project outcomes. Alignment happens through shared experiences. Teams see the same behaviors. Discussions become grounded in real scenarios. Decisions are made with collective understanding. Unity accelerates progress. Digital twins align teams around shared reality.
Great plants are predictable because teams understand their behaviors
Energy and throughput improve with smarter modeling. Some think optimization requires new equipment, but simulation reveals hidden capacity, and energy waste becomes visible. Optimization begins with understanding system behavior.
The fastest way to improve energy use and production throughput is to understand how plants behave under different conditions. Digital twins uncover opportunities that aren’t obvious in the field. Modeling reveals efficiency. Optimization accelerates with insight. Teams test scenarios without risk. Bottlenecks become visible instantly. Energy behavior becomes predictable under different loads. Insight creates opportunity. Digital twins reveal hidden potential in every plant.
Smarter systems, engineering and operations
Process control engineers can develop and confirm innovations before they’re implemented. They can increase process efficiency, capacity and safety by working with operations and process engineering, and use knowledge from higher-fidelity simulations to recognize the value of better instrumentation, procedure automation for startups, and transitions and state-based control to automate preemptive corrective actions to address equipment problems.
Safety engineers can understand and identify root causes to provide more effective safety instrumented systems (SIS). Operators can focus on improvements, rather than tracing problems due to less intelligent control systems, confusion, and chasing operational mistakes.
Digital twins reduce costs and errors
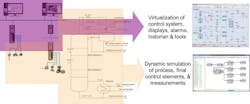
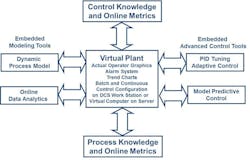
A digital twin enables using the actual system’s basic and advanced control features and tools, online data analytics, operator graphics and data historian as depicted in Figures 1 and 2. This greatly reduces project costs and prevalent errors in emulating algorithms and tools. The results can be translated more efficiently and productively into process and operator performance improvements.
What’s not fully appreciated is the consequence of lacking experimentation with actual plant to develop innovations that eliminate potential operator errors. Concerns about loss of production, validation and regulatory compliance, lacking prerequisite knowledge, and unfamiliarity with potential benefits typically prevent deviations from standard operations.
All these issues can be addressed by a digital twin and virtual plant before, during and after the project. The deep knowledge gained by fast and free exploration of the virtual plant can result in a focused and trusted design of experiments (DOE), dynamic response tests for confirming virtual plant results, and implementing more intelligent alarms, operator interface and control systems.
Breakthroughs
Greg fortunately had enough time to research and develop models for digital twins. In many cases, there were breakthroughs that enabled better dynamic models and process control improvement tools. While all were innovative, some had quite simple concepts and implementations.
Greg also developed a future-value block that updated each execution’s rate of change by subtracting the output from the input to a deadtime block, and dividing the result by the deadtime block setting. The deadtime is selected to provide good signal-to-noise ratio. Prevalent methods of computing the rate of change over a selected interval introduce a significant delay in updated values.
The rate of change updated each execution by using a deadtime block for batch-profile control. Using key batch variables, such as temperature or composition rate of change as the controlled variable (batch profile slope) for a PID or MPC, is essential because it enables negative as well as positive corrections essential for feedback control. If the controlled variable was batch temperature or composition instead of batch profile slope, decreases in controlled variable aren’t possible. The rate of change is multiplied by a specified time to provide a future value. The specified time is often the dead time, but it can be shorter or longer.
The display and trend of the future value can greatly increase operator understanding. Also, it can be used to predict batch endpoint, and enable smarter and more effective control of setpoint changes in batch and continuous operations. In fact, setpoint rise time and overshoot can be minimized to provide a full-throttle batch or startup response by having controller output track maximum value, and then putting the controller back in automatic with a smart final resting value, when the future value predicts the controlled variable will reach setpoint.
The future value can also be used to predict surge to provide preemptive control by having the surge controller track an intelligent output for surge recovery. The controller is returned to automatic when the operating point has recovered far enough away from the surge curve. Greg developed a momentum balance that enables modeling of the complete compressor characteristic curve, including the hidden curve to the left of the surge point that exhibits positive feedback, which causes extremely rapid jumps in compressor flow. Even the fastest feedback control can’t deal with these jumps, which is why surge-control systems need open-loop preemptive corrections.
It’s a great step forward that simulation can recognize the hidden factor in temperature and composition control seen in the temperature versus the ratio of manipulated to feed flow plot. This factor, the inverse of feed flow, is obvious from the derivative for the energy and material balance. Process engineers can appreciate the consequences of open-loop gain dramatically increasing at low production rates. That can cause oscillations when combined with longer deadtimes from greater transportation delays for lower flows in plug-flow volumes, often steeper slopes in the temperature or composition plot versus the ratio, greater valve stiction near the closed position, and more noise in flow signals, unless they’re addressed by process, equipment and automation system designs.
For example, jacket temperature controllers should manipulate a makeup coolant flow with a recycle and pressure control of cooling water return flow to keep jacket flow constant. A precise throttling valve must regulate the coolant; this should consist of a globe valve with low-friction packing, a sensitive diaphragm actuator and a high gain sensitive positioner.
Greg developed a rapid modeler block that can estimate the dynamic model from an open-loop test within six deadtimes. This is much faster than conventional methods for lag dominant processes because they typically wait for the response to reach 98% of its final value, which could take an order of magnitude or more of open-loop test time.
In addition, Greg developed a bioreactor model with kinetic parameters that are incredibly easy to set with convenient cardinal equations. They set optimum, minimum and maximum operating values for pH and temperature. Traditional kinetic equations for hydrogen concentrations and temperatures require parameters accurate to seven decimal places. He also devised test practices to speed up bioreactor batch simulations as much as 500 times, so mammalian cell bioreactors with batch cycle times of weeks can be simulated in hours. He also come up with a non-intrusive method using model-predictive control (MPC) to adapt model parameters.
Get your subscription to Control's tri-weekly newsletter.
Greg further developed a charge balance with adjustable activity coefficients and dissociation constants for acids, bases and solvents, plus parameters for conjugate salts that are quickly and simply solved by means of interval halving. Previously, the pH charge balance shown in literature was simplified, and not accurate for the complex solutions encountered in industrial applications.
The compressor models seen in industry to date critically lack the momentum balance needed to show path, and include the normally unseen compressor characteristic curve to the left of the surge point. Greg developed a momentum balance from innovative research documented by E. M. Greitzer in “The stability of pumping systems—the 1980 Freeman scholar lecture,” Journal of Fluids Engineering, p. 193–242, June 1981, and subsequently confirmed through testing by K.E. Hansen et al. in “Experimental and theoretical study of surge in a small centrifugal compressor,” Journal of Fluids Engineering, p. 391–395, September 1981.
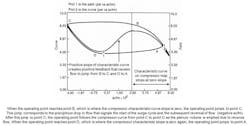
The surge point on the compressor map that’s typically a plot of compressor pressure rise versus suction flow is the point where the slope of the characteristic curve becomes zero. Each characteristic curve corresponds to a particular speed or inlet guide vane position. Plot 2 in Figure 3 shows the compressor characteristic curve seen and unseen. Compressor manufacturers often don’t show the compressor characteristic curve to the left of the surge point creating a mystery and vulnerability.
A first-principle model shows how negative and positive feedback occurs from the sign and magnitude of slopes seen and unseen in compressor characteristic curves. The negative slope of the curve to the right of the surge point provides some negative feedback to help with stability. As the flow decreases, the pressure increases, fueling more downstream valve pressure drop and possibly flow. If the downstream valve position continues to decrease, the operating point proceeds to walk to the left from point “A” along the characteristic curve. When the operating point reaches the zero-slope point, it jumps in about 0.03 seconds to a negative flow that signifies the beginning of the surge cycle. It’s kind of like walking up a mountain and then falling off a cliff. The compressor’s characteristic curve to the left of the surge point creates a total characteristic curve that looks like a sign wave (Figure 1). The positive slope immediately to the left of the surge point (maximum compressor pressure rise) creates positive feedback that causes the operating point to jump from point “B” to point “C” in plot 1, which is the start of the negative slope. The operating point walks along the negative slope from “C” to “D,” the point of zero slope (minimum compressor pressure rise), and then jumps to the right back to the starting point “A.”
If a surge valve isn’t opened, the process repeats, resulting in oscillations. Note that jumps in the suction flow measurement between peaks and valleys aren’t seen in pressure measurements due to smoothing by suction and header volumes. The jumps are highly disruptive and damaging due to high axial thrust and radial vibration. Surge cycles damage bearings and decrease efficiency with each surge cycle. For axial compressors, the damage may be measurable after a few surge cycles. The total number of surge cycles provides a good metric of the total loss in compressor efficiency. It’s imperative to both prevent the surge and to ensure sustained recovery.
Root-cause analysis
Root-cause analysis in process plants is often limited by restricted testing, incomplete data, and the difficulty of separating correlation from true cause and effect. Data analytics can reveal patterns, but without dynamic context, they frequently identify symptoms such as oscillations, variability or alarms, rather than the underlying mechanisms driving them.
A high-fidelity digital twin overcomes these limitations by enabling safe, repeatable experimentation across the full operating envelope. First-principles models with energy, material and momentum balances, combined with realistic instrumentation, control logic and final control element dynamics, preserve the true process behavior and time constants that determine plant response. This level of fidelity is essential because small delays, nonlinearities and interaction effects often dominate root causes.
The digital twin allows disturbances, failures and operating changes to be introduced deliberately and independently. Sensor lag, valve stiction, analyzer cycle time, controller mode changes, communication delays and operator actions can be isolated, and replayed under identical conditions. This makes it possible to determine whether variability originates in the process, automation system, mechanical equipment or operator response.
High-fidelity simulation also exposes dynamic root causes that are difficult to detect with steady-state or historical analysis. Loop interactions, resonance between tuning and process dynamics, and amplification through recycling or integrating processes can be evaluated using time-domain and frequency-domain analyses. Operator actions can be tested and standardized, revealing whether inconsistent responses, alarm design or control strategy limitations contribute to observed behaviors.
By validating hypotheses in the digital twin before plant testing, root-cause analysis becomes faster, safer and more conclusive. The digital twin provides a common reference for operations, engineering and maintenance, enabling decisions based on verified cause-and-effect relationships, and supporting sustained improvements in control performance and operational reliability.
Operator performance
Operator performance contributes to process variability, particularly during startups, transitions, abnormal situations and shift changes. Even in well-automated plants, differences in experience, interpretation of alarms, preferred control modes and response timing can lead to measurable differences in safety, efficiency and capacity. These effects are difficult to isolate and quantify in an operating plant, where experimentation is constrained, and outcomes are influenced by many simultaneous factors.
A high-fidelity digital twin provides a controlled environment in which operator actions can be evaluated objectively. By using the same control system configuration, graphics, alarms and logic as the plant, the digital twin lets operators interact with the process exactly as they would during production. This enables consistent training, repeatable scenario execution, and direct comparison of responses across individuals and shifts.
Through scenario-based training and testing, the digital twin exposes how operator decisions affect dynamic process behavior. Actions, such as changing controller modes, adjusting setpoints, overriding constraints or responding to alarms, can be correlated directly to process stability, recovery time, energy use and product quality. The simulation makes consequences of actions visible within minutes rather than weeks, accelerating learning and reinforcing best practices.
High-fidelity simulation also supports transitions from manual intervention to procedural automation and state-based control. When operator actions are shown to be repeatable and effective, they can be formalized, tested and automated in the digital twin before deployment. This reduces dependence on individual expertise, while improving consistency and resilience during abnormal situations.
By linking operator actions to online performance metrics, the digital twin shifts operator training from subjective evaluation to measurable outcomes. Differences in shift performance become visible and actionable, promoting accountability and continuous improvement. When maintained as a living, operational asset, the digital twin becomes a powerful tool for sustaining operator competence, reducing variability, and aligning human performance with the full capability of the control system.
Process performance
Plants are much more restrictive about testing and changes. This, combined with the tendency for the benefits of automation to not be understood or made visible, results in a dearth of process control improvements. When obsolete control systems are replaced with the latest and best systems, these projects tend to be copy jobs despite great increases in system capability for process control improvement (PCI).
A virtual plant developed for improving operator performance can provide knowledge about process relationships and opportunities. The virtual plant can detail possible PCIs, greatly reduce plant testing needed, and increase safety, capability and efficiency in PCI design and implementation. Online metrics can show the benefits of smarter and more extensive process control. These benefits can justify better automation, and can be prototyped to provide online confirmation. Once benefits are documented, process control can gain the freedom and creativity to expand beyond just dealing with obsolescence.
Operators can also recognize the consequences of the control system not being in the highest control mode. Comparing shift performances can be enlightening and motivating, stirring natural inclinations to compete. Since shift changes are often the time for the greatest disturbances and changes to operating points due to personal preferences for modes and setpoints, recognizing digital twins’ potential impact on shift performance can be particularly beneficial.
A key insight is that myriad improvements can be categorized as increases in process efficiency, capacity, flexibility and safety. Increases in process efficiency show up primarily as decreases in the ratio of the running average of raw material mass or energy used compared to the running average of product mass produced. Increases in process capacity show up as an increased running average of product mass produced. Process capacity increases can be the result of higher production rates, faster startups, better ability to deal with abnormal operation and greater onstream time. In all cases, the product mass must meet each customer’s specifications.
Flexibility shows up as the ability to meet different production rates or different product requirements. Safety shows up as minimizing activations of the safety instrumented system (SIS) besides the obvious metric of minimizing the number of incidents including near misses.
The period for metrics must be large enough to eliminate noise and inverse response, and allow decisions based on objective and process type. For evaluating operator and control system actions, the period is normally the cycle time and operator shift for batch and continuous processes, respectively. The period is a month for correlation with accounting metrics. For alerting operators as fast as possible to the consequence of actions taken (e.g., changing controller setpoint or mode), the period can be reduced to as short as six times the total loop dead time. The metrics at the end of a month, batch or shift are historized.
There’s often a tradeoff between process metrics. Increasing production rate often comes with decreasing efficiency. Similarly, changing production rates reduces process efficiency and capacity because moving to a new process operating point takes time, and the product produced during the transition may not meet specifications. Increases in yield (decrease in raw material use) can be viewed as an increase in process efficiency if the raw material feed rate is decreased accordingly. There may be an accompanying decrease in the cost of recycle and waste treatment operations.
Alternatively, increases in yield can be taken as an increase in process capacity by keeping the raw material feed rate constant. Prolonging a batch can improve yield and thus efficiency, but lengthening batch cycle time translates to less batch capacity, especially as reaction rates or purification rates decline near end point. Time to reach a new setpoint can be shortened by overdriving the manipulated variable past its final resting value. For processes with large volumes, such as distillation columns and reactors, the time reduction is critical. For batch processes, reaching a new composition, pH, pressure or temperature setpoint often isn’t possible without this overdrive. Process efficiency is reduced during overdrive, but process capacity is increased, either as a reduction in batch cycle time or an increase in continuous production rate upon reaching setpoint.
The translation of online metrics to the bottom-line effect on production unit profitability in the plant’s accounting system is especially important. This means benefits must be reported monthly, and presented by accounting format and procedures. Also, obvious but often not addressed, is buy-in by the plant’s accounting department and management. This is best done by using real-time accounting (RTA), which is discussed in the Guide to best return on investment in the process industry (Section 11.12) in the McGraw-Hill Process/Industrial Instruments and Controls Handbook, Sixth Edition. The resulting metrics used for RTA aren’t your typical key performance indicators (KPI).
About the Author

Greg McMillan
Columnist
Greg McMillan retired as a senior fellow at Solutia Inc., now a subsidiary of Eastman Chemical, in 2002. He was an adjunct professor in Washington University Saint Louis’ Chemical Engineering Department 2002-04, and retired as a principal senior software developer at Emerson Automation Solutions in 2024.
Edin Rakovic
Prosera
Edin Rakovic is the founder and CEO of Prosera, where he leads global teams delivering digital twin, dynamic simulation, and operator training solutions that help industrial organizations get the most from their automation and technology investments. He posted insightful digital twin and simulation benefits that are eye-opening motivations for seeking a better future.

Leaders relevant to this article: