More solar energy is radiating down onto our planet than the energy radiated back into space. This difference is called radiative forcing (RF), and according to the Fourth Assessment Report (AR4) of the United Nations Intergovernmental Panel on Climate Change (IPCC), the current level of radiative forcing is 1.6 watts per square meter (the range of uncertainty of this value is from 0.6 to 2.4). 93% of this extra energy is absorbed by the oceans, resulting in a yearly rise in the ocean's temperature of about 0.015 °C/yr.
While this temperature rise is small, the amount of energy required to cause it equals about 50 times the total energy use of mankind or the energy released by a couple of Hiroshima bombs every second. Global warming has heated the oceans for the past 150 years, which means that while the atmosphere has been spared from the full extent of global warming for now, this heat already stored in the oceans will eventually be released, causing additional warming of the Earth in the coming decades.
Measuring the heat content of the oceans is a more accurate indication of global warming than its surface temperature. The heat content of the oceans has increased by about 15 x 10²² Joules in the last 30 years or about 0.5 x 10²² Joules each year, and is still rising. Naturally, the total heat received by the planet is more than what is absorbed by the oceans, but the oceans still absorb the bulk of it; oceans reflect less than 10% of radiation received, while the planet reflects about 34% overall.

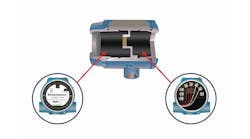
Figure 1: A hydraulic bladder at the tip of the float and a pneumatic bladder on the side serve to vary the float's density. When the density rises, the float sinks, and when it decreases, the float rises. (Courtesy of Michael McClune at Scripps Institution of Oceanography at http://www-argo.ucsd.edu/How_Argo_floats.html)
We should also remember that, even if we were able to cut our emissions to zero today, the carbon already accumulated in the atmosphere will still maintain the elevated greenhouse effect. Plus, the heat that's accumulated in the oceans will continue to heat our planet for decades or centuries to come. In other words, a very small rise in the temperatures of the oceans indicates the absorption of immense quantities of heat.
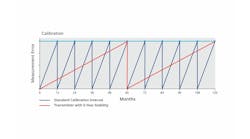
So, how do we measure this yearly, oceanic temperature rise of 0.015 °C/yr, when the detection error of our most accurate Class AA RTDs is on the order of ±0.01 °C? The answer is we can’t, at least not with traditional methods of temperature measurement.
Temperature based on heat content
Measuring the rise in the surface temperature of the oceans doesn't represent the total heat absorbed because that temperature changes with depth. Therefore, a more accurate reading is obtained if average temperature along with that profile is measured. Today, the Argo project is doing just that—measuring temperature and salinity profiles from the surface to 2,000 meters deep at 3,000 points around the globe. The project was conceived and designed by U.S. academics and scientists at the National Oceanic and Atmospheric Administration (NOAA) to obtain a uniform and systematic method for measuring the physical state of the upper layers of the oceans, and place that information into climate computer models in near real-time. The name ‘Argo’ comes from the name of the ship, Argo, in the tale of Jason and the Argonauts told in Greek mythology.

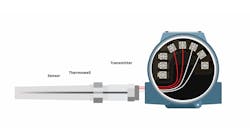
Figure 2: At 10-day intervals, each of the 3,000 Argo floats sinks to a depth of 1,000 meters, where it drifts for nine days. Following that, it sinks to a depth of 2,000 meters, and then slowly rises to the surface over a six-hour period, during which it collects the temperature and salinity profile along the way. When at the surface, it transmits profile data to a satellite, and the cycle starts again.
Argo uses robotic floats (Figure 1) that spend most of their life drifting below the ocean's surface. They make temperature and salinity measurements, and when they surface, they transmit collected data to satellites. After that, they sink again to drift for another 10 days. Currently, these drifting floats, produce some 100,000 temperature/salinity profiles per year. Compared to satellite observations of surface temperatures, profiles gathered by these floats provide much better data for understanding and quantifying climate change.
The Argo floats use density change to drive their movements. The density of any object is the ratio of its weight and its volume. If the density of an object in the ocean drops below that of the water around it, the object will rise and when its density is greater than the surrounding water, it will sink. The Argo float (Figure 2) uses flexible bladders to change its volume (just as fish do). A hydraulic bladder at the tip of the float and a pneumatic bladder on the side, serve to vary the float's density. When the density rises, the float sinks and when it decreases, the float rises.
Roughly 3,000 Argo floats are deployed in the ice-free areas of the world’s oceans, profiling temperature and salinity down to a depth of about 2,000 meters. These floats dramatically reduce the amount of time and cost of gathering such data by research ships using traditional over-the-side methods of ocean observations. On top of that, the data gathered is accurate to about ±0.002°C.
These floats are battery-powered, autonomous units that spend most of their life drifting at a "parking depth" of about 1,000 meters for about 9 days during each measurement cycle, where they're stabilized by automatically matching their density with that of the water around them (Figure 2). At 10-day intervals, they automatically reduce their own volume by lowering the volume of their bladders by pumping some of the fluid from them, and increasing the density of the float, so it will sink to a depth of 2,000 meters. After that, the float automatically reduces its density by increasing its volume (expanding its bladders) and rises to the surface over about a 6 hour period, during which it measures the temperature and salinity in profile. When they surface, the floats transmit their profile data to satellites. After about 20 minutes on the surface, the bladders deflate, the float sinks, and the cycle is repeated. The floats are designed to make about 150 such cycles yearly. By this method, a relatively accurate heat content of the oceans can be calculated, and when tracked over time gives an accurate measure of the oceans’ rate of warming.
The average temperature at the surface of planet Earth is currently 15.1 °C (59.0 °F), rising at the rate of 0.15 °C (0.27 °F) per decade. Over land, the average surface temperature is currently 10 °C (50 °F), rising at the rate of 0.1 °C (0.18 °F) per decade. And at the surface of the ocean, the average temperature is currently more than 17 °C (62.6 °F), rising at the rate of 0.25 °C (0.5 °F) per decade. Since pre-industrial times, that's up 1.1 °C (2.0 °F) on average, including 1.5 °C (2.7 °F) over land and 0.7 °C (1.26 °F) over the sea.